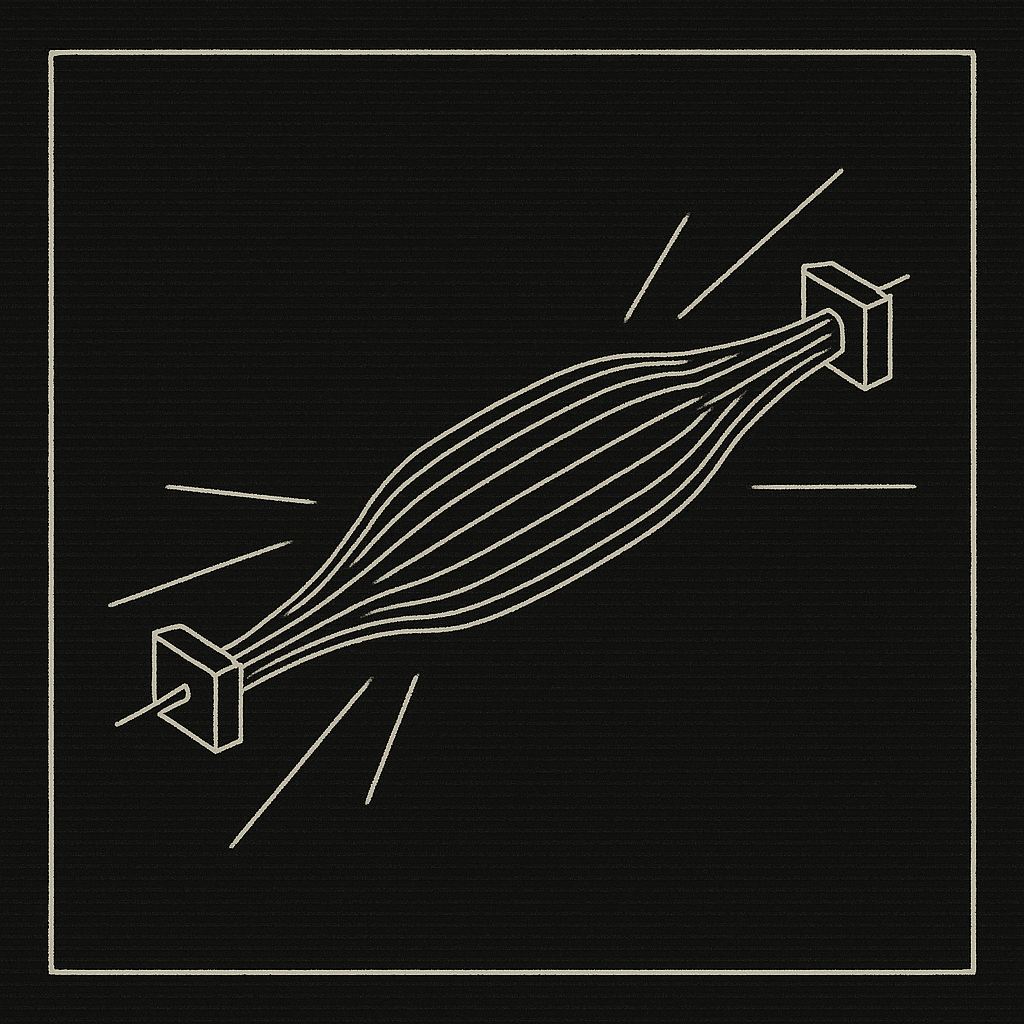
THE MACHINERY OF ELITE MUSCLE
A Complete Guide to Building High-Density, Durable Tissue
Why Damage Is Not the Signal
What follows is not a training program.
It is not a philosophy of grit. Not a set of percentages. Not another progressive-overload spreadsheet wrapped in physiology.
It is mechanism.
The actual machinery by which a muscle fiber senses load, sends a signal, synthesizes protein, fuses a myonucleus, and emerges a day later slightly thicker and slightly more durable than before. The tissue layer underneath the folk model of no-pain-no-gain. The molecular cascade underneath the bodybuilding magazine.
The folk model claims that muscle grows because it is damaged. That progress requires grinding past pain. That more is better. That failure is the stimulus.
Every component of that model is wrong at the tissue level.
Muscle does not grow because it is damaged. It grows because it is tensioned. Damage is a side effect of tension, not the cause of adaptation. Grinding past pain does not add signal. It adds noise, and in sufficient doses, destroys the tissue the signal was meant to build.
This document is the replacement.
Nothing more.
What you do with it is your business.
PART ONE: WHAT MUSCLE ACTUALLY IS
The Tissue, Described Physically
A muscle is not a single thing. It is a hierarchy of sleeves.
The whole muscle is wrapped in epimysium. Inside it, bundles of fibers (fascicles) are wrapped in perimysium. Each individual muscle fiber (a single elongated cell, often spanning the length of the fascicle) is wrapped in endomysium. Inside each fiber, thousands of myofibrils run in parallel. Inside each myofibril, sarcomeres repeat end to end. Inside each sarcomere, filaments of actin and myosin interlock.
Contraction happens at the sarcomere. Force at the sarcomere is transmitted to the endomysium, through the perimysium, up the epimysium, and out the tendon. Most of that transmission is lateral, not longitudinal.
Lateral transmission through the costamere, a protein complex sitting at the Z-disc and coupling the sarcomere to the sarcolemma and extracellular matrix, accounts for approximately 70 to 80 percent of the force that leaves a muscle fiber (Peter et al. 2011, Progress in Biophysics and Molecular Biology). Longitudinal transmission accounts for the remaining 20 to 30 percent.
The costamere is not just a pipe. It is also a sensor. Integrins at the costamere detect mechanical deformation and initiate intracellular signaling that regulates protein synthesis and autophagy.
Tension gets sensed at the same place it gets transmitted.
Fiber Types
Humans express three myosin heavy chain isoforms in skeletal muscle: MyHC-I, MyHC-IIa, MyHC-IIx (Schiaffino & Reggiani 2011, Physiological Reviews). The isoform a fiber predominantly expresses determines its contractile speed, fatigue resistance, metabolic profile, and appearance.
    FIBER TYPE PROPERTIES

    ┌──────────────┬──────────────┬──────────────┬──────────────┐
    │              │   TYPE I     │   TYPE IIa   │   TYPE IIx   │
    ├──────────────┼──────────────┼──────────────┼──────────────┤
    │ Twitch speed │   Slow       │   Fast       │   Fastest    │
    │ Fatigue      │   Resistant  │   Moderate   │   Rapid      │
    │ Metabolism   │   Oxidative  │   Oxidative- │   Glycolytic │
    │              │              │   glycolytic │              │
    │ Mitochondria │   Dense      │   Moderate   │   Sparse     │
    │ Capillaries  │   Dense      │   Moderate   │   Sparse     │
    │ Force / CSA  │   Low        │   High       │   Highest    │
    │ Color        │   Red        │   Pink       │   White      │
    │ Myoglobin    │   High       │   Moderate   │   Low        │
    └──────────────┴──────────────┴──────────────┴──────────────┘
With chronic resistance training, the fast-twitch family shifts within itself. IIx transitions toward IIa (Staron et al. 1994, Journal of Applied Physiology). True slow-to-fast or fast-to-slow conversion is rare in humans. The shift is inside the fast pool.
The fiber-type distribution of a given muscle in a given person is mostly fixed. The training does not turn a slow fiber into a fast one. It turns an unconditioned fast fiber into a more oxidative, more fatigue-resistant fast fiber, and it grows all the fibers it recruits.
Architecture: Pennation, Fascicle Length, PCSA
Muscle fibers do not always run straight from origin to insertion. In pennate muscles, fibers run at an angle to the line of pull, packed like feathers.
Pennation trades fiber length for fiber count. A pennate muscle can produce up to six times more isometric force than a non-pennate muscle of equal volume, because it fits more fibers per unit of cross-section (Van Hooren et al. 2024, Scandinavian Journal of Medicine & Science in Sports).
Physiological cross-sectional area (PCSA) is fiber count times average fiber cross-sectional area, measured perpendicular to the fibers. Force capacity scales with PCSA, not with anatomical cross-section.
Pennation angle correlates with muscle thickness in the hypertrophied state (Kawakami, Abe, & Fukunaga 1993, Journal of Applied Physiology). Growth is both radial (increases pennation) and longitudinal (adds sarcomeres in series, lengthens fascicles).
    PENNATION TRADE-OFF

    NON-PENNATE (parallel):

       ─────────────► fiber
       ─────────────►
       ─────────────►

       Long fibers. Few per CSA. Fast shortening.


    PENNATE:

       ╲   ╲   ╲   ╲   fibers at angle
        ╲   ╲   ╲   ╲
         ╲   ╲   ╲   ╲
          ╲   ╲   ╲   ╲

       Short fibers. Many per CSA. High force.
       Force reduced per fiber to tendon by cos(angle).
       Gain from packing exceeds the cosine loss.
Titin
Titin is the largest known protein, roughly 3.8 million daltons, spanning Z-disc to M-band inside every sarcomere (Herzog 2018, Biophysical Reviews; Linke 2010, Journal of Biomedicine and Biotechnology). It is the third filament alongside actin and myosin.
Titin provides passive elasticity. It centers myosin filaments within the sarcomere. It transmits active force during eccentric contraction. Eliminate titin from a myofibril and both passive and active force collapse.
Titin is why a lengthened muscle resists being pulled apart, why a sarcomere that has been stretched returns to its resting configuration, and why eccentric contractions produce more force than concentric ones at the same velocity. The “third filament” is not decorative. It is load-bearing.
PART TWO: WHAT GETTING STRONGER ACTUALLY MEANS
Neural First, Hypertrophy Later
When an untrained person begins resistance training, strength rises long before muscle size does.
Moritani & deVries (1979, American Journal of Physical Medicine) quantified this in an 8-week isotonic training study. In the first two weeks, approximately 80 percent of strength gain was attributable to neural factors. Hypertrophy did not become the dominant contributor to strength until after the third to fifth week.
Most of what a new trainee experiences in the first month is not new muscle. It is the nervous system learning to drive the muscle it already has.
    NEURAL vs HYPERTROPHIC CONTRIBUTION TO STRENGTH

    Contribution
    to strength
    gain
         │
    HIGH │ ████
         │ ████ ████
         │ ████ ████ ████
         │ ████ ████ ████ ███                Hypertrophy
         │ ████ ████ ████ ███  ████
         │ ████ ████ ████ ███  ████ ████ ████ ████
         │ ████ ████ ████ ███  ████ ████ ████ ████
         │ ████ ████ ████ ███  ████ ████ ████ ████
    MED  │ ░░░░ ░░░░ ░░░░ ░░░  ░░░░ ░░░░ ░░░░ ░░░░
         │ ░░░░ ░░░░ ░░░░ ░░░  ░░░░ ░░░░ ░░░░ ░░░░
         │ ░░░░ ░░░░ ░░░░ ░░░  ░░░░ ░░░░ ░░░░ ░░░░
         │ ░░░░ ░░░░ ░░░░ ░░░  ░░░░         Neural
         │ ░░░░ ░░░░ ░░░░ ░░░
    LOW  │ ░░░░ ░░░░
         │
         └─────────────────────────────────────────►
           Wk1  Wk2  Wk3  Wk4  Wk5  Wk6  Wk7  Wk8

           ░░ Neural         ██ Hypertrophic
What Changes in the Nervous System
Multiple adaptations happen at once.
Motor unit recruitment thresholds fall, letting the trainee access high-threshold units at lower perceived effort (Duchateau, Semmler, & Enoka 2006, Journal of Applied Physiology). Max discharge rates rise, so the same motor unit contributes more force. Doublets (short-interval paired discharges) become more common. Antagonist coactivation falls, so the agonist’s force is not being dragged against by its opposite (Carolan & Cafarelli 1992, Journal of Applied Physiology).
Upstream of the spinal motoneuron, corticospinal excitability increases. Motor-evoked potentials at matched force grow. Short-interval intracortical inhibition falls. The cortical silent period shortens (Siddique et al. 2020, Sports Medicine; Kidgell et al. 2017, European Journal of Neuroscience).
Part of what people call strength is a skill. Intermuscular coordination improves. Agonist synchronization, synergist recruitment, stabilizer timing. The pattern becomes cleaner (Sale 1988, Medicine & Science in Sports & Exercise).
Evidence for the neural locus includes cross-education. Train one limb. The untrained limb gains strength. The muscle did not grow on the side that was not loaded. The nervous system learned on both.
Implications
The first month of training is mostly learning. The second is mostly learning. By the end of the third month, the gains are a mix. Hypertrophy begins to dominate after about the eighth week in most trainees, and from there the curve bends in the direction of physical growth.
A training system that rushes to “progressive overload” in the first weeks is optimizing for a signal (hypertrophy) that is not yet dominant, using a measurement (load moved) that is mostly reporting on a different signal (skill). Load will rise regardless, because the motor pattern is stabilizing.
Patience here is not a virtue. It is calibration.
PART THREE: THE HYPERTROPHY SIGNAL
Mechanical Tension as Primary Driver
Three mechanisms have been proposed for hypertrophy: mechanical tension, muscle damage, and metabolic stress (Schoenfeld 2010, Journal of Strength & Conditioning Research). Two decades of subsequent work have converged on a single primary driver.
Mechanical tension is the signal.
Damage and metabolic stress are secondary at best. In many contexts they are neutral. In excessive doses, subtractive.
The signal begins at the sarcolemma and costamere. Load deforms the membrane. Integrins at the costamere sense this deformation. Phosphatidic acid accumulates at the membrane. Filamin-C-BAG3 complexes regulate mTORC1, Hippo, and autophagy signaling. Nuclear deformation initiates additional cascades. Multiple candidate mechanosensors feed into the same downstream pathway (Wackerhage et al. 2019, Journal of Applied Physiology).
The downstream pathway is mTOR.
The mTOR Cascade
mTORC1 (mechanistic target of rapamycin complex 1) is the central regulator of muscle protein synthesis. Mechanical load activates it. Rapamycin, an mTOR inhibitor, blocks resistance-training-induced hypertrophy entirely (Bodine et al. 2001, Nature Cell Biology; Goodman 2014, Reviews of Physiology, Biochemistry and Pharmacology).
Downstream of mTOR, p70S6K and 4E-BP1 become phosphorylated. Ribosomal translation increases. ULK1 phosphorylation modulates autophagy. The fiber enters a net-synthesis state.
Amino acid availability gates the cascade. Leucine in particular activates Rag GTPases, which recruit mTOR to the lysosomal surface where its activator Rheb resides (Sancak et al. 2008, Science). Without leucine, the machinery has the signal but not the substrate.
    THE HYPERTROPHY SIGNAL CASCADE

    LOAD
      │
      ▼
    ┌─────────────────────────────────────────────────┐
    │  MEMBRANE / COSTAMERE DEFORMATION               │
    │  Integrins, filamin-C-BAG3, phosphatidic acid   │
    └─────────────────────────────────────────────────┘
      │
      ▼
    ┌─────────────────────────────────────────────────┐
    │  mTORC1 ACTIVATION                              │
    │  Requires leucine-dependent Rag-Rheb docking    │
    └─────────────────────────────────────────────────┘
      │
      ├──────────────┬──────────────┐
      ▼              ▼              ▼
    ┌──────────┐  ┌──────────┐  ┌──────────┐
    │ p70S6K   │  │ 4E-BP1   │  │ ULK1     │
    │ ribosome │  │ cap-     │  │ autophagy│
    │ activity │  │ dependent│  │ modulated│
    │ ↑        │  │ translation ↑│           │
    └──────────┘  └──────────┘  └──────────┘
      │              │              │
      └──────────────┼──────────────┘
                     ▼
    ┌─────────────────────────────────────────────────┐
    │  MUSCLE PROTEIN SYNTHESIS (MPS)                 │
    │  Elevated 1-5h post-exercise with protein       │
    └─────────────────────────────────────────────────┘
                     │
                     ▼
    ┌─────────────────────────────────────────────────┐
    │  OVER WEEKS, INTEGRATED NET POSITIVE BALANCE    │
    │  → increased contractile and sarcoplasmic mass  │
    └─────────────────────────────────────────────────┘
The time course of p70S6K phosphorylation parallels muscle protein synthesis, peaking 1 to 5 hours post-exercise with protein ingestion (Wackerhage 2019). Higher training volume produces greater phosphorylation in a dose-response (Terzis et al. 2010, European Journal of Applied Physiology).
Satellite Cells and Myonuclear Addition
Each muscle fiber is multinucleated. Each nucleus supports a finite cytoplasmic domain. When a fiber grows beyond roughly 26 percent, the existing nuclei cannot support the additional cytoplasm. New nuclei must be added.
The source is the satellite cell. A small Pax7-expressing stem cell nestled between the sarcolemma and the basal lamina. Upon activation, satellite cells co-express Pax7 and MyoD, proliferate, differentiate, and fuse to the existing fiber, donating their nucleus to the multinucleated cell (Petrella et al. 2008, Journal of Applied Physiology; Snijders et al. 2015, Frontiers in Physiology). A subset self-renews and returns to quiescence, replenishing the pool.
Acute hypertrophy of up to about eight weeks can occur without new myonuclei. Long-term growth and retraining depend on an intact satellite cell pool (McCarthy et al. 2011, Development). Individuals with larger satellite cell expansion in response to a bout show greater long-term hypertrophy.
Myofibrillar vs Sarcoplasmic Hypertrophy
Not all growth is contractile. A fiber can grow by adding myofibrils (myofibrillar hypertrophy) or by expanding the sarcoplasm (fluid, glycogen, non-contractile protein). Both are real. Both are dissociable (Roberts et al. 2020, Frontiers in Physiology).
High-volume, shorter-rest protocols bias toward sarcoplasmic expansion. In a six-week high-volume study in trained men, myosin and actin concentrations fell even as fiber CSA rose (Haun et al. 2019, PLOS One). The fibers got bigger. The contractile protein per unit of fiber fell.
Low-volume, high-load protocols bias toward myofibrillar expansion. This explains why bodybuilders and powerlifters of similar fiber CSA have different specific tension (force per unit of cross-section). The fibers look the same. The contents are different.
Elite muscle, in the sense of high-density durable tissue, is biased toward myofibrillar content. The fibers hold more of what actually pulls.
PART FOUR: DAMAGE IS NOT THE SIGNAL
The Old Coupling
For decades the training literature assumed that damage was the stimulus. Eccentric contractions produce Z-line streaming, sarcomere disruption, sarcolemmal tearing, intracellular calcium dysregulation. Creatine kinase leaks into the blood. Soreness arrives twelve to forty-eight hours later. The assumption was: the damage is what the body is repairing, and the repair overshoots baseline. No pain, no gain.
Two classes of evidence have dismantled this.
Damage and Synthesis Decouple
Damas et al. (2016, Journal of Physiology) tracked integrated myofibrillar protein synthesis (MPS) and hypertrophy across a ten-week training period in previously untrained men.
At week one, Z-band streaming was highest. MPS was elevated. Hypertrophy was not yet occurring. The synthesis was directed at repair, not at net tissue accretion.
At week three, Z-band streaming had fallen. MPS remained elevated. Hypertrophy began to correlate with MPS.
At week ten, damage markers were minimal. MPS continued to rise after training. Hypertrophy correlated tightly with MPS.
The conclusion follows cleanly: the MPS response of a damaged muscle is not the hypertrophic signal. It is a repair signal. Hypertrophy happens once damage has attenuated and the synthesis machinery can direct its output toward growth instead of toward replacement.
    DAMAGE AND HYPERTROPHY ACROSS A TRAINING PROGRAM

    Week 1         Week 3         Week 10
    ──────         ──────         ──────

    Damage: ████   Damage: ██     Damage: ·

    MPS:    ████   MPS:    ████   MPS:    ████
            │              │              │
            ▼              ▼              ▼
    Directed at    Mixed repair   Directed at
    REPAIR         and growth     GROWTH

    Hypertrophy:   Hypertrophy:   Hypertrophy:
    ·              ██             █████

    MPS-hypertrophy correlation: none -> partial -> strong
Damas, Libardi, & Ugrinowitsch (2018, European Journal of Applied Physiology) summarized the updated view: damage may be permissive but is not required, and excessive damage impairs adaptation.
The Repeated-Bout Effect
A naive eccentric bout causes large damage. A second identical bout within six months produces markedly reduced damage markers (McHugh 2003, Scandinavian Journal of Medicine & Science in Sports; Nosaka & Clarkson 1995, Medicine & Science in Sports & Exercise). The mechanism involves neural adaptation (altered motor unit recruitment), mechanical adaptation (added sarcomeres in series, titin-based changes), and cellular remodeling of the cytoskeleton and extracellular matrix.
The adaptation is to tolerate the work, not to endure the damage. Progress is the reduction of damage at a given load, not the accumulation of damage over time.
DOMS, the delayed soreness that follows unaccustomed work, does not scale with the damage that matters (Nosaka, Newton, & Sacco 2002, Scandinavian Journal of Medicine & Science in Sports). Soreness is noise. Progress in strength and muscle thickness can occur with and without DOMS in equal measure.
Tension Without Damage
Flann et al. (2011, Journal of Experimental Biology) trained subjects eccentrically with and without a pain-inducing loading ramp. Both groups hypertrophied equivalently. The group that never experienced the damaging/sore phase grew as much as the group that did.
Schoenfeld (2012, Journal of Strength & Conditioning Research) reviewed the broader literature and concluded that tension, not damage, is the adaptive variable. The two commonly travel together because high-tension eccentric work tends to cause damage, but the correlation is circumstantial. Tension without damage produces hypertrophy. Damage without tension does not.
Elite muscle is built by staying in the tension-rich, damage-sparse lane. Not by accumulating micro-tears. By repeatedly loading the fiber near its force capacity without crossing into cytoskeletal disruption.
PART FIVE: THE DOSE-RESPONSE
Volume
Hypertrophy scales with total weekly volume, measured as hard sets per muscle per week (Schoenfeld, Ogborn, & Krieger 2017, Journal of Sports Sciences). A dose-response meta-analysis across fifteen studies and thirty-four treatment groups found each additional set per week adding an effect size of approximately 0.023, corresponding to roughly 0.37 percent additional gain per set. Higher-volume conditions produced roughly 3.9 percent greater hypertrophy than lower-volume.
The ceiling is not definitively established and appears to vary by individual, training age, and recovery capacity. In trained men, hypertrophy continues to scale with volume even as strength plateaus (Schoenfeld et al. 2019, Medicine & Science in Sports & Exercise).
Frequency
Frequency, when volume is equated, does not meaningfully affect hypertrophy (Schoenfeld, Grgic, & Krieger 2018, Journal of Sports Sciences). Hitting a muscle twice a week with ten sets each versus once a week with twenty sets produces equivalent growth, assuming the single session is recoverable.
Non-volume-equated comparisons modestly favor higher frequency, but only because higher frequency raises total volume. Frequency is a distribution variable. It controls how volume is spread, not whether it accumulates.
Strength follows the same pattern (Grgic et al. 2018, Sports Medicine). When volume is equated, frequency is not an independent driver.
Intensity
Loads from roughly 30 percent of one-repetition-maximum (1RM) to greater than 80 percent of 1RM produce equivalent hypertrophy, provided sets are taken close to failure (Schoenfeld, Wilson, Lowery, & Krieger 2016, European Journal of Sport Science). The “hypertrophy rep range” of 8 to 12 reps is a convenience zone, not a mechanistic requirement.
Strength adaptations are load-specific. Heavier loads produce greater 1RM gains. The transfer of light-load training to maximal strength is limited.
Lasevicius et al. (2018, European Journal of Sport Science) showed that at equated volume load, light loads at 20 percent 1RM produced less hypertrophy than moderate and heavy loads. Very light loads require close-to-failure effort to match heavier loads. They are inefficient in proximity to failure but not incapable of producing growth.
    DOSE VARIABLES

    Variable         Direct driver?        Modulates via
    ────────         ──────────────        ─────────────
    Volume           Yes                   Additive; dose-response
    Frequency        No (distribution)     Spreads volume over time
    Intensity        Yes, for strength     Interacts with proximity
                     Equivalent for        to failure at moderate
                     hypertrophy when      and heavy loads
                     taken near failure
    Proximity to     Yes, especially       At light loads, failure
    failure          at light loads        is required; at heavy
                                           loads, 1-3 RIR suffices
    Protein intake   Gating                ~20 g per bolus young men;
                                           up to ~40 g whole-body
Protein Dose
Approximately 20 grams of high-quality protein maximally stimulates MPS in young men after a lower-body session (Moore et al. 2009, American Journal of Clinical Nutrition). Whole-body sessions raise the threshold to roughly 40 grams (Macnaughton et al. 2016, Physiological Reports).
Below this dose, the cascade has the signal but not the substrate. The Rag-Rheb docking does not occur at full capacity. mTORC1 does not receive the leucine input that fully activates it.
Above this dose, the cascade is saturated. Additional protein does not produce additional acute MPS.
Protein is a gating variable. Not proportional. The signal is either met or it is not.
PART SIX: SUB-FAILURE TRAINING
RIR and RPE
Repetitions in reserve (RIR) is a scale that operationalizes proximity to failure. RIR 0 is failure. RIR 1 is one rep before failure. RIR 3 is three reps before failure. Modified RPE (rating of perceived exertion) for resistance training uses the same information on a 1-10 scale: RPE 10 = failure, RPE 9 = 1 RIR, etc. (Helms et al. 2016, Strength & Conditioning Journal; Zourdos et al. 2016, Journal of Strength & Conditioning Research).
Intermediate and advanced lifters estimate RIR accurately after familiarization. Novices systematically underestimate RIR (they think they have fewer reps left than they do).
The Key Finding
Lasevicius et al. (2019, Journal of Strength & Conditioning Research) ran a four-group study: low load vs high load, failure vs non-failure.
At high load (approximately 12-rep max, roughly 70 percent 1RM), failure and non-failure produced equivalent hypertrophy. The non-failure group stopped each set one to three reps short of failure. They grew just as much.
At low load (approximately 34-rep max, roughly 30 percent 1RM), failure was required to produce meaningful hypertrophy.
Heavy loads already recruit the high-threshold motor units. Failure at heavy loads is redundant. Light loads require the effort proxy to drive full recruitment.
Carroll et al. (2019, Sports) extended this across ten weeks with trained lifters, three sessions per week: failure versus relative intensity (a percentage-based, submaximal approach). The relative-intensity group improved more across nearly all measures. The failure group showed blunted adaptation. Effect sizes moderately favored non-failure.
Grgic et al. (2021, Journal of Sport and Health Science) meta-analyzed the question. Volume-equated: no significant hypertrophy difference between failure and non-failure. Non-volume-equated: non-failure slightly favored for strength.
Refalo et al. (2024, Journal of Sports Sciences) extended to eight weeks in trained individuals. 1 to 3 RIR produced equivalent hypertrophy to training to momentary muscular failure.
The RIR Curve
    ADAPTATION PER SET vs RIR AT MODERATE-TO-HEAVY LOAD

    Adaptive
    signal
    per set
         │
         │
    HIGH │       ████████████
         │     ████████████████
         │    ██████████████████
         │   ████████████████████
    MED  │  █████████████████████
         │  █████████████████████
         │ ██████████████████████
         │ ██████████████████████
    LOW  │████████████████████████
         │████████████████████████
         │
         └────────────────────────────────────►
           5    4    3    2    1    0   (-1 junk)
                      RIR (reps in reserve)

    Plateau from RIR 0 to RIR 3 at moderate-heavy loads.
    Past failure adds fatigue cost without adding signal.
Velocity-Based Training
Mean propulsive velocity in a given exercise has a near-perfect relationship with percentage of 1RM within an individual. González-Badillo & Sánchez-Medina (2010, International Journal of Sports Medicine) reported R² ≈ 0.98 in bench press. The velocity corresponding to a given percentage is stable across training periods.
Daily velocity gives real-time auto-regulation. A 1RM fluctuates day to day with sleep, stress, nutrition (Weakley et al. 2022, Strength & Conditioning Journal). Velocity measures the current state, not an average state.
Velocity loss within a set predicts adaptive outcomes (Pareja-Blanco et al. 2017, Scandinavian Journal of Medicine & Science in Sports). Low velocity loss (10 to 20 percent drop within a set) preserves neural adaptations and power while minimizing fatigue. High velocity loss (40 percent or more) produces greater hypertrophy but blunts power adaptations and accumulates fatigue.
The Mechanistic Basis of “Effortless”
The convergence: proximity to failure, not failure itself, is sufficient for full adaptation at moderate and heavy loads. Velocity drop within a set quantifies fatigue accumulation in real time and allows set termination before the damaging portion begins. Training leaves room in the tank. Adaptation accrues from signaling, not from exhaustion.
What looks like “training less hard” is training in the lane where mTOR receives the signal it needs without the damage signature that slows the next session. The last reps before failure add fatigue. They add soreness. They add injury risk. They do not add hypertrophy at moderate and heavy loads beyond what the prior reps already accomplished.
The machinery runs on tension near but not at the edge. It does not run on the edge itself.
PART SEVEN: RECOVERY IS WHERE ADAPTATION HAPPENS
The Signal Fires When You Stop
The training session generates the signal. The adaptation happens in the hours and days afterward. If the recovery window is not honored, the signal does not resolve into new tissue. It resolves into accumulated fatigue, degraded performance, and eventually maladaptation.
Meeusen et al. (2013, Medicine & Science in Sports & Exercise) described a continuum from functional overreaching to non-functional overreaching to overtraining syndrome. Functional overreaching produces a short-term performance decrement that resolves with short recovery and produces supercompensation. Non-functional overreaching produces a prolonged decrement requiring weeks or months. Overtraining syndrome is chronic maladaptation across biological, neurochemical, and hormonal systems, with no single biomarker and no quick recovery.
The window between stimulus and supercompensation is where the gain lives. Miss it by undertraining and no gain accrues. Miss it by overtraining and the gain is consumed by the damage.
    THE SUPERCOMPENSATION WINDOW

    Performance
    capacity
         │
    HIGH │                            ┌────────  supercompensation
         │                           /               plateau
         │                          /  ← adaptation
         │          ┌───┐          /
    BASE │──────────┘   \          /  ────────────────
         │               \        /
         │                \      /
         │                 \    /
         │  stimulus       \  /   recovery
    LOW  │                   ▼     window
         │                  fatigue/
         │                  dip
         └──────────────────────────────────────────►
                                                Time

    If next stimulus arrives here ─┤ ─────┤
                                    │      │
                          too early  just right (supercompensated)
                          fatigue    gains compound
                          compounds
Sleep and Anabolism
Sleep is the dominant recovery variable. Restricted sleep shifts the endocrine environment toward catabolism.
Dattilo et al. (2011, Medical Hypotheses) proposed the framework. Subsequent literature confirmed it. Sleep debt raises cortisol, lowers testosterone, lowers IGF-1, and increases proteolysis.
Nedeltcheva et al. (2010, Annals of Internal Medicine) compared 5.5 hours of sleep to 8.5 hours during caloric restriction. Lean mass loss was 60 percent greater in the short-sleep group. Fat loss was 55 percent lower. The same training and diet produced worse body composition outcomes with less sleep.
Leproult & Van Cauter (2011, JAMA) found a 10 to 15 percent drop in daytime testosterone after one week of five-hour nights in healthy young men. One week.
HRV as a Recovery Marker
Heart rate variability, specifically vagal-related indices (RMSSD, lnRMSSD), tracks autonomic recovery (Buchheit 2014, Frontiers in Physiology). Greater training load produces smaller vagal HRV and slower heart rate recovery.
HRV is noisy on a single day (day-to-day coefficient of variation of 5 to 10 percent) but stabilizes as a 7-day rolling average (Plews et al. 2013, Sports Medicine). A positive HRV trend parallels performance gain. HRV suppression can precede performance decline by days. It is a leading indicator.
Elite athletes in homogeneous groups can show HRV saturation, where the signal flattens even as load accumulates. In those cases coefficient-of-variation metrics and weekly rolling averages handle the noise better than single-day readings.
Central vs Peripheral Fatigue
Fatigue has two sources (Gandevia 2001, Physiological Reviews). Central fatigue is reduced voluntary activation from the central nervous system. Peripheral fatigue is reduced force-generating capacity at the muscle itself.
Central fatigue recovers in minutes to hours. Peripheral damage can take days.
High-force training biases peripheral fatigue. The muscle is the bottleneck. Sarcomeres need time to resynthesize protein, replenish glycogen, clear calcium.
High-volume training biases central fatigue. The CNS is the bottleneck. Drive is reduced even when the muscle is fresh.
The two types of fatigue have different recovery timescales. A training program that ignores the difference will either undertrain or burn through the CNS.
PART EIGHT: THE SLOW TISSUE
Tendon and Connective Tissue
Muscle adapts on a scale of days to weeks. Tendon adapts on a scale of weeks to months.
Bohm, Mersmann, & Arampatzis (2015, Sports Medicine - Open) meta-analyzed 27 studies of human tendon adaptation. Tendon responds to loading, but the loading magnitude is the primary driver, not the contraction type. Approximately 90 percent of 1RM and long loading durations (three seconds or more per rep) appear optimal for tendon stiffness adaptation.
Muscle protein half-life in the body is on the order of days. Tendon collagen in the core has a half-life measured in months to years (Magnusson, Langberg, & Kjaer 2010, Nature Reviews Rheumatology). Collagen synthesis rises within hours of loading, but turnover is extremely slow. Loading a tendon repeatedly without sufficient synthesis window creates net collagen degradation. Roughly 72 hours may be required between heavy tendon-loading sessions for net positive balance (Magnusson et al. 2008, Journal of Applied Physiology).
Why People Blow Tendons
Muscle CSA and force-generating capacity can outpace tendon stiffness. When they do, strain on the tendon rises disproportionately. Tendinopathy and rupture risk rise with it (Mersmann, Bohm, & Arampatzis 2017, Frontiers in Physiology).
The trainee whose muscle has grown 20 percent while their tendon has adapted 5 percent is carrying a structural liability. The tendon is now underbuilt relative to what the muscle can produce. Each near-maximal contraction applies a higher strain than the tendon has adapted to.
This is not theoretical. It is the common pattern of Achilles and patellar tendinopathy in returning athletes and aggressively progressing lifters.
    THE ADAPTATION TIMELINE MISMATCH

    Relative adaptation
         │
         │                              ┌─ Muscle CSA
    HIGH │                           ┌──┘
         │                        ┌──┘
         │                     ┌──┘
         │                  ┌──┘
    MED  │               ┌──┘
         │            ┌──┘
         │         ┌──┘    ·····  Tendon stiffness
         │      ┌──┘    ····
    LOW  │   ┌──┘   ····
         │┌──┘ ····
         │·····
         └─────────────────────────────────────────►
          Wk 2   Wk 6   Wk 12  Wk 24   Wk 52

    The gap between curves is the strain budget.
    It widens before it closes.
    Rupture and tendinopathy live in the gap.
Heavy Slow Resistance
Heavy slow resistance (HSR) is the training modality that addresses tendinopathy and preemptively conditions the tendon. Roughly 70 percent of 1RM, six seconds per rep (three concentric, three eccentric), three sessions per week, twelve weeks (Kongsgaard et al. 2009, Scandinavian Journal of Medicine & Science in Sports).
HSR produces equivalent short-term clinical improvement to eccentric-only training, superior collagen turnover markers, and better adherence. Beyer et al. (2015, American Journal of Sports Medicine) confirmed non-inferior 12-week and 52-week outcomes against eccentric training for Achilles tendinopathy, with better tolerance.
Malliaras et al. (2022, Sports Medicine) emphasized that load magnitude is the active ingredient. The tempo alone is not the signal. “Heavy slow” must be actually heavy.
For the builder of elite muscle, the implication is that tendon work must be programmed explicitly. It cannot be assumed to come along for the ride of hypertrophy work. The adaptive timescales are different. The dose-response is different. The tendon is its own tissue.
PART NINE: THE FORGOTTEN ARCHITECTURE
The Stabilizers No One Trains
Most training volume targets the prime movers. Pectorals. Lats. Quadriceps. Hamstrings. Deltoids. These are the visible muscles. They move the weights.
Underneath them sits another layer. Feet and toes. Ankle invertors and evertors. Deep neck flexors and extensors. Scapular stabilizers. Rotator cuff. Small hip stabilizers. Deep trunk.
This layer does not move the big weights. It enables them. Proximal stability permits distal mobility. Weak stabilizers force compensation. Compensation reduces force transfer efficiency and redistributes strain to tissues not built to handle it (McGill 2010, Strength & Conditioning Journal).
The Foot Core
McKeon, Hertel, Bramble, & Davis (2015, British Journal of Sports Medicine) proposed the foot core paradigm. The small intrinsic foot muscles (abductor hallucis, flexor digitorum brevis, abductor digiti minimi, quadratus plantae, lumbricals, flexor hallucis brevis, adductor hallucis, flexor digiti minimi, dorsal interossei) provide local stabilization analogous to the lumbopelvic core. The extrinsic muscles (tibialis posterior, peroneus longus, flexor hallucis longus) provide global control.
Intrinsic foot weakness correlates with plantar fasciitis, medial tibial stress syndrome, Achilles tendinopathy, and chronic ankle instability. Mulligan & Cook (2013, Manual Therapy) found that four weeks of short-foot exercise improved arch height and navicular drop. Taddei et al. (2020, American Journal of Sports Medicine) found that eight weeks of foot core training reduced running injury risk by a factor of 2.42.
Most people do not load their feet. Shoes absorb the stimulus. The intrinsic muscles atrophy quietly.
The Neck
Hrysomallis (2016, Sports Medicine) reviewed neck strength and injury risk. Greater neck strength and girth reduce angular head acceleration from impacts. Collins et al. (2014, Journal of Primary Prevention) found that every one-pound increase in neck strength was associated with a five percent reduction in concussion odds in high school athletes.
The neck is trainable (isometric or dynamic). It is rarely trained.
The Scapula
Kibler et al. (2013, British Journal of Sports Medicine) issued consensus on scapular dyskinesis. Altered scapular position or motion is associated with impingement, rotator cuff pathology, instability, and labral tears. The lower trapezius and serratus anterior form a force couple for posterior tilt and upward rotation. These muscles are commonly weak or underactive in dyskinesis.
Cools et al. (2014, British Journal of Sports Medicine) describe activation patterns: low rows, inferior glides, lawn-mowers, serratus punches, prone Y/T/W raises, prone shoulder abduction with external rotation to optimize lower trap to upper trap ratio.
The Rotator Cuff
The rotator cuff (supraspinatus, infraspinatus, teres minor, subscapularis) is small muscle mass with outsized importance. Reinold et al. (2009, Journal of Orthopaedic & Sports Physical Therapy) documented that infraspinatus and teres minor require isolation work because the larger prime movers mask their contribution. External rotator strength deficits predict shoulder injury in overhead athletes.
The Architecture Map
    THE UNDER-TRAINED STABILIZER LAYER

    Region          Stabilizers                       Compensation
                                                       if weak
    ──────          ───────────                       ────────────
    Foot            Intrinsic foot core (abd hallucis,   Plantar fascia
                    FDB, QP, lumbricals, FHB, etc.)     overload, medial
                                                         tibial stress
    Ankle           Tibialis posterior, peroneus       Chronic ankle
                    longus, flexor hallucis longus     instability
    Knee            VMO, popliteus                     Patellar tracking
                                                         error
    Hip             Gluteus medius, deep rotators,     Valgus collapse,
                    psoas                              anterior tilt
    Trunk deep      Transversus abdominis,             Lumbar loading
                    multifidus, diaphragm              errors
    Scapula         Lower trap, serratus anterior,     Impingement,
                    rhomboids                          dyskinesis
    Shoulder        Rotator cuff (SS, IS, TM, Sub)     RC tears, labral
                                                         pathology
    Neck            Deep neck flexors, longus colli,   Concussion risk,
                    upper traps (balanced)             cervicogenic pain
The pattern is consistent. Each of these tissues has a clear adaptation response. Each responds to targeted, low-to-moderate load work. Each is routinely skipped because it does not contribute visible size.
Elite muscle without elite architecture is an unfinished build. The prime movers can outgrow what the stabilizers can support, which shifts strain into joints and tendons that are not built for it.
PART TEN: THE FAILURE MODES
Rhabdomyolysis
Rhabdomyolysis is skeletal muscle breakdown releasing intracellular contents (myoglobin, CK, potassium, phosphate, urate) into circulation (Zutt et al. 2014, Neuromuscular Disorders; Knochel 1990, Kidney International). Acute kidney injury from myoglobinuria is the feared complication. Mortality approaches five percent when AKI is present.
The thresholds (Kenney et al. 2012, Muscle & Nerve): CK greater than five times upper limit of normal is elevated. Greater than 1000 U/L meets the rhabdomyolysis criterion. Greater than 5000 U/L is severe. Cases exceeding 100,000 U/L occur.
Post-eccentric-exercise CK elevations of 2000 to 5000 U/L without clinical symptoms are common. Clinical rhabdomyolysis requires the triad of CK elevation, myoglobinuria, and muscle pain or weakness.
The risk pattern is recognizable. Novice performing high-intensity unfamiliar eccentric work. Recent heat or dehydration. Sickle cell trait. Low protein intake or recent alcohol. The CrossFit-associated literature (Meyer et al. 2018, Clinical Journal of Sport Medicine; Thiebaud et al. 2020, Cureus) documents the pattern of high-rep eccentric kipping work in insufficiently prepared athletes.
No clean biomarker separates adaptive damage from pathological damage. The heuristic that matters for the tissue builder: if acute damage markers persistently exceed the repeated-bout-adapted baseline for that athlete, the stimulus is regressive, not progressive.
Fibrosis
When muscle cannot regenerate, it scars. Failed repair replaces contractile tissue with fibrotic scar (collagen I/III, fibronectin). The scar does not contract. The scar does not transmit force cleanly. The scar does not regenerate further.
TGF-β1 and TGF-β2 drive myofibroblast conversion from fibroadipogenic progenitor cells (FAPs) (Mann et al. 2011, Skeletal Muscle; Delaney et al. 2017, Cell Biology International). Acute TGF-β1 is beneficial at low levels for early extracellular matrix deposition. Chronic elevation is pathological. Repeated injury, chronic inflammation, and age all shift the balance from regeneration toward fibrosis.
Brack et al. (2007, Science) showed that aging satellite cells shift from myogenic to fibrogenic fate via Wnt signaling. Biressi et al. (2014, Science Translational Medicine) described the Wnt-TGFβ2 axis reprogramming muscle stem cells toward fibrogenic output in chronic injury settings.
Exercise, programmed appropriately, is antifibrotic. Resistance training downregulates TGF-β, reduces collagen deposition, and improves satellite cell responsiveness (Delfinis et al. 2021, FASEB). Exercise programmed inappropriately (repeated damage without recovery window) is profibrotic.
Sarcopenic Drift
Aging shifts the baseline. Cruz-Jentoft et al. (2019, Age and Ageing) defined sarcopenia as age-related loss of muscle mass, strength, and function, affecting roughly one-third of older adults.
The mechanisms are multiple (Larsson et al. 2019, Physiological Reviews; Marzetti et al. 2013, International Journal of Biochemistry & Cell Biology). Motor unit loss. Denervation-reinnervation cycles expand motor unit size and preferentially atrophy type II fibers. Mitochondrial quality-control failure. Intramuscular fat infiltration. Fibrotic replacement of contractile tissue. The satellite cell pool declines. Remaining cells are less responsive to activation cues.
Elite muscle is, among other things, a hedge against this trajectory. Not because aging can be refused, but because the decline proceeds from a higher baseline and follows a shallower slope in those who have continuously loaded their tissue across decades.
Failure Mode Summary
    THE THREE DEGENERATIVE PATHS

    ┌─────────────────────────────────────────────────┐
    │  RHABDOMYOLYSIS                                 │
    │                                                 │
    │  Acute, catastrophic cytoskeletal disruption    │
    │  CK ≫ 5× ULN, myoglobinuria, AKI risk           │
    │                                                 │
    │  Trigger: high-intensity unfamiliar eccentric   │
    │  work in insufficiently prepared tissue         │
    │                                                 │
    │  Reversible if caught; potentially fatal        │
    └─────────────────────────────────────────────────┘

    ┌─────────────────────────────────────────────────┐
    │  FIBROSIS                                       │
    │                                                 │
    │  Chronic failed repair; scar replaces fiber     │
    │  TGF-β1/β2 driven FAP-to-myofibroblast shift    │
    │                                                 │
    │  Trigger: repeated injury without recovery;     │
    │  chronic inflammation; age                      │
    │                                                 │
    │  Partially reversible; prevention is easier     │
    │  than reversal                                  │
    └─────────────────────────────────────────────────┘

    ┌─────────────────────────────────────────────────┐
    │  SARCOPENIC DRIFT                               │
    │                                                 │
    │  Age-related motor unit loss, type II           │
    │  atrophy, fat infiltration, satellite pool      │
    │  exhaustion                                     │
    │                                                 │
    │  Trigger: disuse + age + fibrotic background    │
    │                                                 │
    │  Slowed by continuous loading; never reversed   │
    │  to baseline of youth                           │
    └─────────────────────────────────────────────────┘
These are the three ways the machinery breaks. Acute cytoskeletal rupture. Chronic failure to regenerate. Slow replacement by non-contractile tissue. Each has a training-modifiable trajectory.
PART ELEVEN: INDIVIDUAL VARIATION
The Scale of Variance
Hubal et al. (2005, Medicine & Science in Sports & Exercise) ran 585 subjects through twelve weeks of unilateral elbow flexor training.
CSA change ranged from minus 2 percent to plus 59 percent. 1RM gain ranged from 0 percent to plus 250 percent. MVC change ranged from minus 32 percent to plus 149 percent.
Same program. Same duration. Same measurement. Thirty-fold differences in hypertrophy response.
Women showed greater relative strength gains. Men showed slightly greater absolute CSA gains. Ahtiainen et al. (2016, AGE) confirmed the heterogeneity pattern across sexes and ages.
The Non-Responder Question
Timmons (2011, Journal of Applied Physiology) proposed a biological basis for variability. A 29-transcript signature in vastus lateralis before training predicts later VO2max response. The HERITAGE family study estimated that approximately 47 percent of VO2max response variance is heritable (Bouchard et al. 2011, Journal of Applied Physiology).
But Montero & Lundby (2017, Journal of Physiology) showed something important. When training dose was increased for previous “non-responders,” they responded. Non-response is often dose-limited, not categorical.
The practical meaning: the individual curve matters more than the group average. A program calibrated to the group mean will under-dose some and over-dose others. Both fail, for opposite reasons.
Genetic Markers
ACTN3 R577X encodes a fast-twitch structural protein (α-actinin-3). RR homozygotes have full expression. XX homozygotes lack it entirely. RR is enriched in elite sprint/power athletes. XX is enriched in elite endurance athletes (Eynon et al. 2013, Sports Medicine; Pickering & Kiely 2017, Frontiers in Physiology).
Effect size is small. ACTN3 explains roughly one percent of sprint time variance. ACE I/D shows the same pattern: statistically real, effect size small.
The human gene map for performance phenotypes includes more than 200 associated genes (Bray et al. 2009, Medicine & Science in Sports & Exercise). Polygenic inheritance. No single-gene test predicts performance.
    GENETICS vs INDIVIDUAL MONITORING

    ┌──────────────────────────────────────────────┐
    │  GENETIC TESTING                             │
    │                                              │
    │  Known markers: ACTN3, ACE, 200+ loci        │
    │  Effect sizes: ~1% variance each             │
    │  Predictive power: low                       │
    │  Actionable output: near-zero                │
    │  Cost: moderate                              │
    │                                              │
    │  Verdict: statistically real,                │
    │           practically non-informative        │
    └──────────────────────────────────────────────┘

    ┌──────────────────────────────────────────────┐
    │  WITHIN-INDIVIDUAL MEASUREMENT               │
    │                                              │
    │  Metrics: velocity, grip, HRV, CMJ, soreness │
    │  Sensitivity: high                           │
    │  Predictive power: high                      │
    │  Actionable output: direct                   │
    │  Cost: low                                   │
    │                                              │
    │  Verdict: the signal that matters            │
    └──────────────────────────────────────────────┘
The individual is the unit of observation. Not the group. Not the genotype. The machinery in this body, on this day, producing this signal.
PART TWELVE: MEASUREMENT
What the Machinery Emits
The adapting body is not silent. It emits measurable signals. Some are cheap. Some are expensive. Some are signal. Some are noise.
An adaptive training system reads these signals and adjusts prescription based on them. A non-adaptive system ignores them and follows a template.
Bar Velocity
Mean propulsive velocity in a given exercise has R² ≈ 0.95 to 0.98 against percentage of 1RM within an individual (Weakley et al. 2021, Strength & Conditioning Journal). Trial-to-trial coefficient of variation is 2 to 5 percent with quality linear position transducers or accelerometers.
Velocity is sensitive to daily readiness. A day of poor sleep and elevated stress shows in the velocity at a given load before it shows in subjective effort.
González-Badillo et al. (2017, Journal of Strength & Conditioning Research) demonstrated velocity-based 1RM prediction with R² ≈ 0.95 without requiring near-max effort. Lower injury risk than true 1RM testing.
Signal. Moderate cost once device is acquired.
Grip Strength
Leong et al. (2015, The Lancet) analyzed 140,000 participants in the Prospective Urban Rural Epidemiology study. Each 5 kg decrease in grip strength was associated with a 16 percent increase in all-cause mortality. Stronger predictor than systolic blood pressure.
Grip correlates with overall strength, function, bone density, fall risk, cognition, depression, mortality (Bohannon 2019, Clinical Interventions in Aging). Test-retest reliability excellent with standardized protocol (Jamar dynamometer, mean of three trials per hand).
Signal. Very cheap.
HRV
Single-day HRV is noisy. Day-to-day coefficient of variation is 5 to 10 percent.
Seven-day rolling average of lnRMSSD is reliable and tracks both acute and chronic load (Plews et al. 2013, Sports Medicine). Positive trend parallels performance gain. Suppression can precede performance decline by days.
Caveats: elite saturation, individual baseline variability, non-training confounders (alcohol, stress, illness, caffeine timing).
Signal with averaging. Noise as single-day.
CMJ (Countermovement Jump)
Claudino et al. (2017, Journal of Science and Medicine in Sport) meta-analyzed CMJ as a neuromuscular status monitor. Jump height coefficient of variation intraday is roughly 5 to 6 percent. Interday is roughly 12 percent.
Jump height alone can be gamed by altered mechanics. Contraction time, peak power, and the flight-time-to-contraction-time ratio are more sensitive to neuromuscular fatigue than jump height per se. Force-plate-derived variables (peak absolute power, mean relative power) are more reliable than many kinematic measures.
Signal. Especially with force-plate instrumentation.
Soreness
Impellizzeri & Maffiuletti (2007, Clinical Journal of Sport Medicine) validated categorical 0-6 or 0-10 Likert scales for DOMS monitoring. Moderately correlated with CK and force deficit within an individual. Poorly correlated between individuals.
Useful as a within-athlete trend marker. Poor between-athlete comparator. Noisy.
Signal vs Noise Table
| Metric | Cheap? | Signal | Noise | Best Use |
|---|---|---|---|---|
| Mean bar velocity | Medium (device) | High | Low | Daily load auto-regulation |
| Grip strength | Very | Moderate (neuromuscular state) | Low | Weekly / monthly trend, population screening |
| HRV (7-day rolling) | Cheap (wearable) | Moderate | Moderate (day-to-day) | Weekly recovery trend |
| CMJ peak power | Medium | High | Low to moderate | Neuromuscular fatigue tracking |
| CMJ height | Cheap | Moderate | Moderate to high | Less sensitive than power metrics |
| Soreness (Likert) | Free | Low to moderate | High | Within-athlete trend only |
| eRM from bar velocity | Medium | High | Low | Daily 1RM proxy |
| 1RM test | Free | High | Low to moderate | Infrequent. Fatigue-inducing |
| CK (blood draw) | Expensive | High (damage) | Moderate | Acute overload detection |
The sensor layer for an adaptive prescription engine lives in this table. Velocity and grip are the highest signal-to-burden ratios. HRV with averaging is a useful slow variable. CMJ is high-value with appropriate instrumentation. Soreness and single-day HRV are low-information inputs that should not drive prescription changes.
PART THIRTEEN: THE LOOP
The Full Cycle
    THE STIMULUS-RECOVERY-ADAPTATION LOOP

    ┌─────────────────────────────────────────────────┐
    │  STIMULUS                                       │
    │                                                 │
    │  Mechanical tension applied via load × reps     │
    │  Proximity to failure: RIR 1-3                  │
    │  Volume accumulates per muscle per week         │
    │  Velocity preserved within-set (loss < 20-25%)  │
    └─────────────────────────────────────────────────┘
                           │
                           ▼
    ┌─────────────────────────────────────────────────┐
    │  SIGNAL CASCADE                                 │
    │                                                 │
    │  Costamere/integrin sensing                     │
    │  → mTORC1 activation (leucine-gated)            │
    │  → p70S6K, 4E-BP1 phosphorylation               │
    │  → muscle protein synthesis ↑                   │
    │  → (if growth demands it) satellite cell        │
    │    activation, myonuclear addition              │
    └─────────────────────────────────────────────────┘
                           │
                           ▼
    ┌─────────────────────────────────────────────────┐
    │  RECOVERY WINDOW                                │
    │                                                 │
    │  Sleep: 7-9h; testosterone/IGF-1 preserved      │
    │  HRV: 7-day rolling average returns to baseline │
    │  Central fatigue resolves (hours to 1-2 days)   │
    │  Peripheral damage resolves (1-3 days)          │
    │  Tendon collagen balance (72h for heavy load)   │
    └─────────────────────────────────────────────────┘
                           │
                           ▼
    ┌─────────────────────────────────────────────────┐
    │  ADAPTATION                                     │
    │                                                 │
    │  Myofibrillar content ↑ (primary elite marker)  │
    │  Sarcoplasmic content ↑ (volume-dependent)      │
    │  Pennation, fascicle geometry shift             │
    │  Neural drive ↑ (weeks 1-8 dominant)            │
    │  Tendon stiffness ↑ (months)                    │
    │  Stabilizer recruitment ↑ (if trained)          │
    └─────────────────────────────────────────────────┘
                           │
                           ▼
    ┌─────────────────────────────────────────────────┐
    │  NEW BASELINE                                   │
    │                                                 │
    │  Tissue more durable                            │
    │  Tissue more force-dense                        │
    │  Damage response to same load attenuates        │
    │    (repeated-bout effect)                       │
    │  Next stimulus operates on a higher ceiling     │
    └─────────────────────────────────────────────────┘
                           │
                           ▼
                    (loop returns)
The loop compounds when each phase is honored. Stimulus with insufficient tension produces no signal. Stimulus crossing into damage consumes recovery on repair rather than growth. Recovery truncated by insufficient sleep or excessive subsequent load prevents the adaptation from resolving. Adaptation unrecognized because measurement is absent leads to prescriptions that miss the window.
Connection to Adjacent Machinery
The loop is not peculiar to muscle. The same shape recurs across the machinery writings.
In [[THE_MACHINERY_OF_WILLPOWER]], the finding was that the override cascade is fragile, slow, and motivationally decaying. The trainees who appear to have the most willpower are the ones who have structured their lives to need the least. The same architecture applies here. Elite muscle is built by those who have structured their training to avoid needing heroic effort. Proximity-to-failure work at RIR 1-3 does not require the override circuit to fire. Failure work does. The system that trains at the edge of tissue damage is the same system that burns through the prefrontal override circuit. Both break for the same reason: the signal does not require the cost.
In [[THE_MACHINERY_OF_HABIT]], behavior automates through repetition until the basal ganglia handle it without prefrontal engagement. Training that compounds is habitual training. Training that requires continuous motivational renewal is not compounding. It is being paid for out of a depleting resource that the willpower writing described.
In [[THE_MACHINERY_OF_DISCIPLINE]], the framing was that discipline is the behavioral layer built on top of the willpower circuit. Its primary function is to reduce the number of situations requiring override. The same applies to the training lane. The discipline of training is not the ability to grind. It is the architectural choice of a training style that does not demand grinding.
In [[THE_MACHINERY_OF_MOTIVATION]], motivation is described as a computation, not a resource. The dopaminergic signal scales with prediction error. The training system that produces regular, small, trackable adaptations generates ongoing signal. The training system that produces occasional breakthroughs separated by long stretches of grinding produces prolonged flat signal and eventual disengagement.
In [[THE_MACHINERY_OF_DESIRE]], the finding was that desire is a wanting system distinct from liking. The trainee who chases the feel of near-failure is responding to the wanting system’s calibration to effort cost, not to the signal the tissue actually receives. The tissue does not reward effort. It responds to tension. The disconnect between what the mind wants and what the tissue needs is why the folk model of training is self-reinforcing despite being mechanistically wrong.
Inevitability by Architecture
The marathon runner who never quits is not displaying superhuman willpower. Their habit circuits handle the miles. Their environmental design removed the decision points. Their identity computation makes “I am a runner” a high-precision prior that weights the continuation of the run heavily.
The strong person who has been strong for decades without injury is not displaying superhuman resilience. Their tendons adapted alongside their muscle because the loading protocol was heavy-and-slow-enough to signal the collagen without being fast-and-frequent-enough to degrade it. Their stabilizers were trained because the program budgeted volume for them. Their sleep and HRV were honored because the sessions were programmed at sustainable volume. Their fiber composition shifted toward myofibrillar density because the intensity lived at RIR 1-3 rather than at or past failure. Their satellite cell pool remained responsive because damage was kept below the threshold where TGF-β chronically elevated.
Each of these is a choice of architecture, not a trait of character.
The tissue adapts. The machinery runs on tension and recovery. What looks like a decade of effortless progress is the result of a decade of tension without damage, recovery without truncation, stabilizer work without neglect, and measurement without self-deception.
That is not discipline in the folk sense. It is a system where the default behavior produces the outcome.
What Elite Muscle Actually Is
Elite muscle is not big muscle.
It is high-density contractile tissue, with myofibrillar content weighted toward the force-producing filaments rather than sarcoplasmic fluid. It is muscle whose pennation and fascicle geometry have adapted to the movement pattern it is asked to produce. It is muscle whose tendon is stiff enough to transmit the force the fiber can generate, and whose costameres transmit 70 to 80 percent of the force laterally without tissue disruption. It is muscle embedded in an architecture of stabilizers that do not compensate, does not force strain into joints not built for it, and does not harbor fibrotic scar.
It is muscle that has been built through years of repeated sub-failure exposure. Through sleep. Through measurement. Through recovery honored. Through tendons trained alongside the prime movers. Through intrinsic foot muscles activated. Through neck strength maintained. Through scapular stabilizers trained in the positions where they fire. Through CK elevations bounded below the repeated-bout-adapted baseline. Through HRV tracked, velocity measured, protein dosed.
The machinery does not know whether its operator understands it. It runs regardless. But it runs differently in different operators. It runs one way in the operator who believes damage is the signal and grinds through it. It runs another way in the operator who loads tension, measures signal, and rests.
The first produces tissue with pathology. The second produces tissue with durability.
That difference is not ability. It is architecture.
What you do with that observation is your business.
CITATIONS
Muscle Structure and Architecture
Schiaffino, S., & Reggiani, C. (2011). “Fiber Types in Mammalian Skeletal Muscles.” Physiological Reviews, 91(4):1447-1531.
Staron, R.S., Karapondo, D.L., Kraemer, W.J., Fry, A.C., Gordon, S.E., Falkel, J.E., Hagerman, F.C., & Hikida, R.S. (1994). “Skeletal muscle adaptations during early phase of heavy-resistance training in men and women.” Journal of Applied Physiology, 76(3):1247-1255.
Kawakami, Y., Abe, T., & Fukunaga, T. (1993). “Muscle-fibre pennation angles are greater in hypertrophied than in normal muscles.” Journal of Applied Physiology, 74(6):2740-2744.
Van Hooren, B., et al. (2024). “The role of pennation angle and architectural gearing to rate of force development.” Scandinavian Journal of Medicine & Science in Sports.
Peter, A.K., Cheng, H., Ross, R.S., Knowlton, K.U., & Chen, J. (2011). “The costamere bridges sarcomeres to the sarcolemma in striated muscle.” Progress in Biophysics and Molecular Biology.
Herzog, W. (2018). “The multiple roles of titin in muscle contraction and force production.” Biophysical Reviews, 10:1187-1199.
Linke, W.A. (2010). “Roles of Titin in the Structure and Elasticity of the Sarcomere.” Journal of Biomedicine and Biotechnology.
Hypertrophy Mechanisms
Schoenfeld, B.J. (2010). “The Mechanisms of Muscle Hypertrophy and Their Application to Resistance Training.” Journal of Strength & Conditioning Research, 24(10):2857-2872.
Wackerhage, H., Schoenfeld, B.J., Hamilton, D.L., Lehti, M., & Hulmi, J.J. (2019). “Stimuli and sensors that initiate skeletal muscle hypertrophy following resistance exercise.” Journal of Applied Physiology, 126(1):30-43.
Bodine, S.C., et al. (2001). “Akt/mTOR pathway is a crucial regulator of skeletal muscle hypertrophy.” Nature Cell Biology, 3(11):1014-1019.
Goodman, C.A. (2014). “The role of mTORC1 in regulating protein synthesis and skeletal muscle mass in response to various mechanical stimuli.” Reviews of Physiology, Biochemistry and Pharmacology.
Terzis, G., et al. (2010). “The degree of p70S6k and S6 phosphorylation in human skeletal muscle in response to resistance exercise depends on the training volume.” European Journal of Applied Physiology.
Sancak, Y., et al. (2008). “The Rag GTPases bind raptor and mediate amino acid signaling to mTORC1.” Science, 320:1496-1501.
Petrella, J.K., et al. (2008). “Potent myofiber hypertrophy during resistance training in humans is associated with satellite cell-mediated myonuclear addition: a cluster analysis.” Journal of Applied Physiology.
Snijders, T., et al. (2015). “Satellite cells in human skeletal muscle plasticity.” Frontiers in Physiology.
McCarthy, J.J., et al. (2011). “Effective fiber hypertrophy in satellite cell-depleted skeletal muscle.” Development.
Haun, C.T., et al. (2019). “Muscle fiber hypertrophy in response to 6 weeks of high-volume resistance training in trained young men is largely attributed to sarcoplasmic hypertrophy.” PLOS One, 14(6):e0215267.
Roberts, B.M., et al. (2020). “Sarcoplasmic Hypertrophy in Skeletal Muscle: A Scientific ‘Unicorn’ or Resistance Training Adaptation?” Frontiers in Physiology, 11:816.
Damage, DOMS, and the Repeated-Bout Effect
Clarkson, P.M., & Hubal, M.J. (2002). “Exercise-induced muscle damage in humans.” American Journal of Physical Medicine & Rehabilitation.
Nosaka, K., Newton, M., & Sacco, P. (2002). “Delayed-onset muscle soreness does not reflect the magnitude of eccentric exercise-induced muscle damage.” Scandinavian Journal of Medicine & Science in Sports.
Damas, F., Phillips, S.M., Libardi, C.A., Vechin, F.C., Lixandrão, M.E., Jannig, P.R., et al. (2016). “Resistance training-induced changes in integrated myofibrillar protein synthesis are related to hypertrophy only after attenuation of muscle damage.” Journal of Physiology, 594(18):5209-5222.
Damas, F., Libardi, C.A., & Ugrinowitsch, C. (2018). “The development of skeletal muscle hypertrophy through resistance training: the role of muscle damage and muscle protein synthesis.” European Journal of Applied Physiology, 118:485-500.
McHugh, M.P. (2003). “Recent advances in the understanding of the repeated bout effect: the protective effect against muscle damage from a single bout of eccentric exercise.” Scandinavian Journal of Medicine & Science in Sports, 13(2):88-97.
Nosaka, K., & Clarkson, P.M. (1995). “Muscle damage following repeated bouts of high force eccentric exercise.” Medicine & Science in Sports & Exercise.
Schoenfeld, B.J. (2012). “Does exercise-induced muscle damage play a role in skeletal muscle hypertrophy?” Journal of Strength & Conditioning Research, 26(5):1441-1453.
Flann, K.L., LaStayo, P.C., McClain, D.A., Hazel, M., & Lindstedt, S.L. (2011). “Muscle damage and muscle remodeling: no pain, no gain?” Journal of Experimental Biology.
Dose-Response: Volume, Frequency, Intensity, Protein
Schoenfeld, B.J., Ogborn, D., & Krieger, J.W. (2017). “Dose-response relationship between weekly resistance training volume and increases in muscle mass: A systematic review and meta-analysis.” Journal of Sports Sciences, 35(11):1073-1082.
Schoenfeld, B.J., et al. (2019). “Resistance Training Volume Enhances Muscle Hypertrophy but Not Strength in Trained Men.” Medicine & Science in Sports & Exercise.
Schoenfeld, B.J., Grgic, J., & Krieger, J. (2018). “How many times per week should a muscle be trained to maximize muscle hypertrophy? A systematic review and meta-analysis of studies examining the effects of resistance training frequency.” Journal of Sports Sciences, 37(11):1286-1295.
Grgic, J., et al. (2018). “Effects of Resistance Training Frequency on Gains in Muscular Strength: A Systematic Review and Meta-Analysis.” Sports Medicine.
Schoenfeld, B.J., Wilson, J.M., Lowery, R.P., & Krieger, J.W. (2016). “Muscular adaptations in low- versus high-load resistance training: A meta-analysis.” European Journal of Sport Science.
Lasevicius, T., et al. (2018). “Effects of different intensities of resistance training with equated volume load on muscle strength and hypertrophy.” European Journal of Sport Science.
Moore, D.R., et al. (2009). “Ingested protein dose response of muscle and albumin protein synthesis after resistance exercise in young men.” American Journal of Clinical Nutrition.
Macnaughton, L.S., et al. (2016). “The response of muscle protein synthesis following whole-body resistance exercise is greater following 40 g than 20 g of ingested whey protein.” Physiological Reports.
Sub-Failure Training, RIR, and Velocity
Helms, E.R., Cronin, J., Storey, A., & Zourdos, M.C. (2016). “Application of the Repetitions in Reserve-Based Rating of Perceived Exertion Scale for Resistance Training.” Strength & Conditioning Journal, 38(4):42-49.
Zourdos, M.C., et al. (2016). “Novel Resistance Training-Specific Rating of Perceived Exertion Scale Measuring Repetitions in Reserve.” Journal of Strength & Conditioning Research.
Lasevicius, T., et al. (2019). “Muscle Failure Promotes Greater Muscle Hypertrophy in Low-Load but Not in High-Load Resistance Training.” Journal of Strength & Conditioning Research.
Carroll, K.M., et al. (2019). “Skeletal Muscle Fiber Adaptations Following Resistance Training Using Repetition Maximums or Relative Intensity.” Sports, 7(7):169.
Grgic, J., et al. (2021). “Effects of resistance training performed to repetition failure or non-failure on muscular strength and hypertrophy: A systematic review and meta-analysis.” Journal of Sport and Health Science, 11(2):202-211.
Refalo, M.C., et al. (2024). “Similar muscle hypertrophy following eight weeks of resistance training to momentary muscular failure or with repetitions-in-reserve in resistance-trained individuals.” Journal of Sports Sciences.
González-Badillo, J.J., & Sánchez-Medina, L. (2010). “Movement velocity as a measure of loading intensity in resistance training.” International Journal of Sports Medicine, 31(5):347-352.
Pareja-Blanco, F., et al. (2017). “Effects of velocity loss during resistance training on athletic performance, strength gains and muscle adaptations.” Scandinavian Journal of Medicine & Science in Sports.
Weakley, J., et al. (2022). “Velocity-Based Training: From Theory to Application.” Strength & Conditioning Journal.
González-Badillo, J.J., et al. (2017). “Predicting the 1-RM from the load-velocity relationship.” Journal of Strength & Conditioning Research.
Recovery, Sleep, HRV, Fatigue
Meeusen, R., Duclos, M., Foster, C., Fry, A., Gleeson, M., Nieman, D., Raglin, J., Rietjens, G., Steinacker, J., & Urhausen, A. (2013). “Prevention, diagnosis, and treatment of the overtraining syndrome.” Medicine & Science in Sports & Exercise, 45(1):186-205.
Buchheit, M. (2014). “Monitoring training status with HR measures: do all roads lead to Rome?” Frontiers in Physiology, 5:73.
Plews, D.J., et al. (2013). “Training adaptation and heart rate variability in elite endurance athletes.” Sports Medicine, 43(9):773-781.
Gandevia, S.C. (2001). “Spinal and Supraspinal Factors in Human Muscle Fatigue.” Physiological Reviews, 81(4):1725-1789.
Dattilo, M., Antunes, H.K.M., Medeiros, A., Mônico-Neto, M., Souza, H.S., Tufik, S., & de Mello, M.T. (2011). “Sleep and muscle recovery: endocrinological and molecular basis for a new and promising hypothesis.” Medical Hypotheses, 77(2):220-222.
Nedeltcheva, A.V., et al. (2010). “Insufficient sleep undermines dietary efforts to reduce adiposity.” Annals of Internal Medicine.
Leproult, R., & Van Cauter, E. (2011). “Effect of 1 week of sleep restriction to 5 h/night on testosterone levels in young healthy men.” JAMA, 305(21):2173-2174.
Tendon and Collagen
Bohm, S., Mersmann, F., & Arampatzis, A. (2015). “Human tendon adaptation in response to mechanical loading: a systematic review and meta-analysis of exercise intervention studies on healthy adults.” Sports Medicine - Open, 1(1):7.
Mersmann, F., Bohm, S., & Arampatzis, A. (2017). “Imbalances in the development of muscle and tendon as risk factor for tendinopathies in youth athletes.” Frontiers in Physiology.
Kongsgaard, M., Kovanen, V., Aagaard, P., Doessing, S., Hansen, P., Laursen, A.H., et al. (2009). “Corticosteroid injections, eccentric decline squat training and heavy slow resistance training in patellar tendinopathy.” Scandinavian Journal of Medicine & Science in Sports, 19(6):790-802.
Beyer, R., Kongsgaard, M., Kjaer, B.H., Øhlenschlæger, T., Kjaer, M., & Magnusson, S.P. (2015). “Heavy Slow Resistance Versus Eccentric Training as Treatment for Achilles Tendinopathy: A Randomized Controlled Trial.” American Journal of Sports Medicine.
Malliaras, P., et al. (2022). “Putting ‘Heavy’ into Heavy Slow Resistance.” Sports Medicine.
Magnusson, S.P., Langberg, H., & Kjaer, M. (2010). “The pathogenesis of tendinopathy: balancing the response to loading.” Nature Reviews Rheumatology.
Micro-Stabilizers
McKeon, P.O., Hertel, J., Bramble, D., & Davis, I. (2015). “The foot core system: a new paradigm for understanding intrinsic foot muscle function.” British Journal of Sports Medicine, 49(5):290.
Mulligan, E.P., & Cook, P.G. (2013). “Effect of plantar intrinsic muscle training on medial longitudinal arch morphology and dynamic function.” Manual Therapy.
Taddei, U.T., et al. (2020). “Foot Core Training to Prevent Running-Related Injuries: A Survival Analysis of a Single-Blind, Randomized Controlled Trial.” American Journal of Sports Medicine.
Hrysomallis, C. (2016). “Neck Muscular Strength, Training, Performance and Sport Injury Risk: A Review.” Sports Medicine, 46(8):1111-1124.
Collins, C.L., et al. (2014). “Neck strength: a protective factor reducing risk for concussion in high school sports.” Journal of Primary Prevention, 35(5):309-319.
Kibler, W.B., et al. (2013). “Clinical implications of scapular dyskinesis in shoulder injury.” British Journal of Sports Medicine, 47(14):877-885.
Cools, A.M., et al. (2014). “Rehabilitation of scapular dyskinesis: from the office worker to the elite overhead athlete.” British Journal of Sports Medicine.
Reinold, M.M., et al. (2009). “Current concepts in the evaluation and treatment of the shoulder in overhead throwing athletes.” Journal of Orthopaedic & Sports Physical Therapy.
McGill, S.M. (2010). “Core Training: Evidence Translating to Better Performance and Injury Prevention.” Strength & Conditioning Journal.
Failure Modes: Rhabdomyolysis, Fibrosis, Sarcopenia
Knochel, J.P. (1990). “Catastrophic medical events with exhaustive exercise: ‘white collar rhabdomyolysis.’” Kidney International.
Zutt, R., van der Kooi, A.J., Linthorst, G.E., Wanders, R.J., & de Visser, M. (2014). “Rhabdomyolysis: review of the literature.” Neuromuscular Disorders.
Kenney, K., et al. (2012). “Serum creatine kinase after exercise: drawing the line between physiological response and exertional rhabdomyolysis.” Muscle & Nerve.
Meyer, M., et al. (2018). “Exertional and CrossFit-Induced Rhabdomyolysis.” Clinical Journal of Sport Medicine, 28(6).
Thiebaud, R.S., et al. (2020). “Exertional Rhabdomyolysis After CrossFit Exercise.” Cureus.
Mann, C.J., Perdiguero, E., Kharraz, Y., Aguilar, S., Pessina, P., Serrano, A.L., & Muñoz-Cánoves, P. (2011). “Aberrant repair and fibrosis development in skeletal muscle.” Skeletal Muscle, 1:21.
Delaney, K., et al. (2017). “The role of TGF-β1 during skeletal muscle regeneration.” Cell Biology International.
Brack, A.S., Conboy, M.J., Roy, S., Lee, M., Kuo, C.J., Keller, C., & Rando, T.A. (2007). “Increased Wnt signaling during aging alters muscle stem cell fate and increases fibrosis.” Science, 317(5839):807-810.
Biressi, S., Miyabara, E.H., Gopinath, S.D., Carlig, P.M., & Rando, T.A. (2014). “A Wnt-TGFβ2 axis induces a fibrogenic program in muscle stem cells from dystrophic mice.” Science Translational Medicine.
Cruz-Jentoft, A.J., et al. (2019). “Sarcopenia: revised European consensus on definition and diagnosis.” Age and Ageing.
Marzetti, E., et al. (2013). “Mitochondrial dysfunction and sarcopenia of aging.” International Journal of Biochemistry & Cell Biology.
Larsson, L., et al. (2019). “Sarcopenia: Aging-Related Loss of Muscle Mass and Function.” Physiological Reviews, 99(1):427-511.
Delfinis, L.J., et al. (2021). “Exercise training improves skeletal muscle quality in a murine model of sarcopenia.” FASEB.
Neural Adaptations
Moritani, T., & deVries, H.A. (1979). “Neural factors versus hypertrophy in the time course of muscle strength gain.” American Journal of Physical Medicine, 58(3):115-130.
Duchateau, J., Semmler, J.G., & Enoka, R.M. (2006). “Training adaptations in the behavior of human motor units.” Journal of Applied Physiology, 101(6):1766-1775.
Duchateau, J., & Enoka, R.M. (2022). “Adaptations in motor unit properties underlying changes in recruitment, rate coding, and maximum force.” Journal of Neurophysiology.
Del Vecchio, A., et al. (2019). “The increase in muscle force after 4 weeks of strength training is mediated by adaptations in motor unit recruitment and rate coding.” Journal of Physiology.
Carroll, T.J., Riek, S., & Carson, R.G. (2002). “The sites of neural adaptation induced by resistance training in humans.” Journal of Physiology.
Siddique, U., et al. (2020). “Determining the Sites of Neural Adaptations to Resistance Training: A Systematic Review and Meta-analysis.” Sports Medicine.
Kidgell, D.J., et al. (2017). “Corticospinal responses following strength training: a systematic review and meta-analysis.” European Journal of Neuroscience.
Sale, D.G. (1988). “Neural adaptation to resistance training.” Medicine & Science in Sports & Exercise, 20(5 Suppl):S135-145.
Carolan, B., & Cafarelli, E. (1992). “Adaptations in coactivation after isometric resistance training.” Journal of Applied Physiology.
Individual Variation
Hubal, M.J., Gordish-Dressman, H., Thompson, P.D., Price, T.B., Hoffman, E.P., Angelopoulos, T.J., et al. (2005). “Variability in muscle size and strength gain after unilateral resistance training.” Medicine & Science in Sports & Exercise, 37(6):964-972.
Ahtiainen, J.P., et al. (2016). “Heterogeneity in resistance training-induced muscle strength and mass responses in men and women of different ages.” AGE.
Timmons, J.A. (2011). “Variability in training-induced skeletal muscle adaptation.” Journal of Applied Physiology, 110(3):846-853.
Bouchard, C., et al. (2011). “Genomic predictors of the maximal O2 uptake response to standardized exercise training programs.” Journal of Applied Physiology.
Montero, D., & Lundby, C. (2017). “Refuting the myth of non-response to exercise training.” Journal of Physiology, 595(11):3377-3387.
Eynon, N., et al. (2013). “Genes for elite power and sprint performance: ACTN3 leads the way.” Sports Medicine, 43(9):803-817.
Pickering, C., & Kiely, J. (2017). “ACTN3: More than Just a Gene for Speed.” Frontiers in Physiology, 8:1080.
Bray, M.S., et al. (2009). “The human gene map for performance and health-related fitness phenotypes.” Medicine & Science in Sports & Exercise.
Measurement
Weakley, J., et al. (2021). “Velocity-based training: from theory to application.” Strength & Conditioning Journal.
Leong, D.P., et al. (2015). “Prognostic value of grip strength: findings from the Prospective Urban Rural Epidemiology (PURE) study.” The Lancet, 386(9990):266-273.
Bohannon, R.W. (2019). “Grip Strength: An Indispensable Biomarker for Older Adults.” Clinical Interventions in Aging, 14:1681-1691.
Claudino, J.G., et al. (2017). “The countermovement jump to monitor neuromuscular status: A meta-analysis.” Journal of Science and Medicine in Sport.
Impellizzeri, F.M., & Maffiuletti, N.A. (2007). “Convergent evidence for construct validity of a 7-point likert scale of lower extremity muscle soreness.” Clinical Journal of Sport Medicine.
LeSuer, D.A., et al. (1997). “The accuracy of prediction equations for estimating 1-RM performance in the bench press, squat, and deadlift.” Journal of Strength & Conditioning Research.
Document compiled from peer-reviewed physiology, sports medicine, and neuromuscular science literature on skeletal muscle adaptation.
Related Machineries
- [[THE_MACHINERY_OF_WILLPOWER]]. The override cascade. Why grinding through pain burns the same prefrontal circuit whose depletion the training system must not require.
- [[THE_MACHINERY_OF_DISCIPLINE]]. The architectural layer that reduces situations requiring override. In training, the choice of sub-failure work at RIR 1-3 is the discipline.
- [[THE_MACHINERY_OF_HABIT]]. The basal ganglia substrate for training that compounds without continuous motivational renewal.
- [[THE_MACHINERY_OF_MOTIVATION]]. The prediction-error computation that scales with regular trackable adaptation. Why effortless training sustains, and grinding training drops out.
- [[THE_MACHINERY_OF_DESIRE]]. The wanting system’s calibration to effort cost, and why the tissue does not reward effort. It responds to tension.