THE MACHINERY OF MOATS
A Complete Guide to Structural Defensibility
Why Some Businesses Compound and Others Get Competed to Zero
What follows is not advice.
It is not a checklist for building a moat. Not a template for competitive strategy. Not ten things to do before your competitor copies you.
It is mechanism.
The actual machinery that determines whether a business earns returns above its cost of capital for twenty years or gets competed to zero in three. The structural properties that separate businesses with pricing power from businesses trapped in margin compression. The architecture underneath the question every operator eventually faces: why does this keep getting harder.
Most operators never examine this machinery. They feel its effects. The price war that eroded their margins. The competitor who copied the product in six months. The customer who left for a 5% discount. The platform that changed the rules and wiped out the channel. But they never see the structural layer beneath these events.
This document is a description of that layer.
What the operator reading it does next is their business.
PART ONE: THE STRUCTURAL QUESTION
Revenue Is Not Defensibility
A business can have revenue and no moat.
A business can have growth and no moat.
A business can have market share and no moat.
Revenue without a moat is borrowed time. The moment a competitor enters with lower prices, better marketing, or a bigger balance sheet, the revenue migrates. Growth without a moat compounds the problem. The faster a moatless business grows, the louder the signal it sends to competitors that the market is worth entering. Market share without a moat is a holding pattern.
The question underneath every business metric is structural: what prevents this from being competed away.
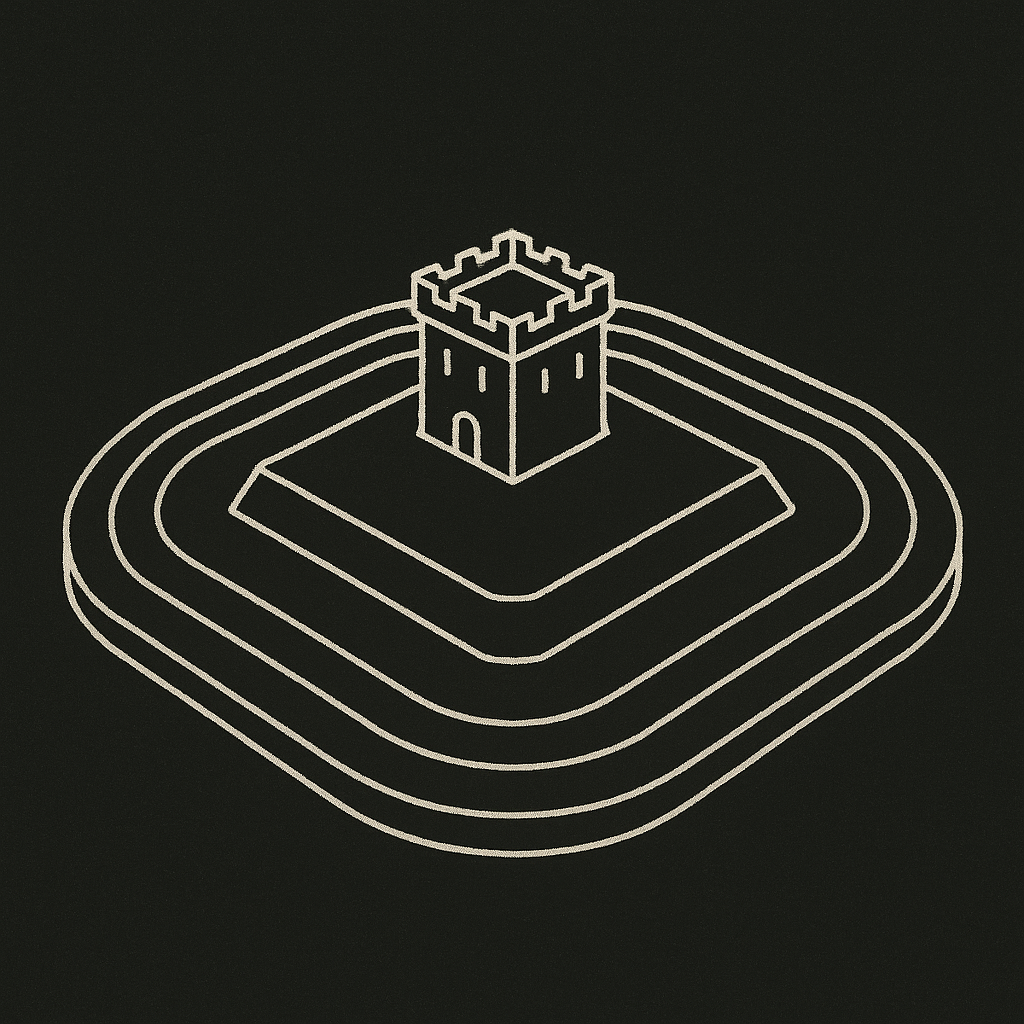
Warren Buffett popularized the metaphor. A business is a castle. The castle’s value depends on the moat surrounding it. A castle with a wide moat can withstand siege. A castle with no moat falls to the first army that arrives.
The metaphor is useful because it separates two things operators routinely confuse. The castle is the product, the team, the revenue, the operations. The moat is the structural condition that protects the castle from competition. They are not the same thing. A beautiful castle with no moat is not a defensible business. An ugly castle with a deep moat is.
    THE CASTLE AND THE MOAT

    ┌──────────────────────────────────────────────────────────┐
    │                                                          │
    │                      THE CASTLE                          │
    │                                                          │
    │    Revenue. Product. Team. Operations.                   │
    │    Market share. Brand awareness. Growth rate.           │
    │                                                          │
    │    These are what the business IS.                       │
    │                                                          │
    └──────────────────────────────────────────────────────────┘
                               │
                               │
                               ▼
    ┌──────────────────────────────────────────────────────────┐
    │                                                          │
    │                       THE MOAT                           │
    │                                                          │
    │    The structural condition that prevents a              │
    │    competitor from taking the castle.                    │
    │                                                          │
    │    This is what PROTECTS the business.                   │
    │                                                          │
    └──────────────────────────────────────────────────────────┘

    The castle can be large and the moat can be empty.
    Most operators build castle. Few build moat.
Buffett’s formulation, stated at the 1995 Berkshire Hathaway shareholders meeting and repeated in various forms for decades after: “What we’re trying to find is a business with a wide and long-lasting moat around it, protecting a terrific economic castle with an honest lord in charge of the castle.”
The key word is not “wide.” It is “long-lasting.” A moat that works for two years is not a moat. It is a head start. Head starts get closed. Moats persist.
The Dual Requirement
Hamilton Helmer, in 7 Powers (2016), formalized what Buffett described intuitively. Every moat requires two components. A benefit and a barrier.
The benefit is the advantage the moat confers on the business. Higher margins. Lower costs. Better retention. Faster growth. Pricing power. The benefit is what shows up in the financials.
The barrier is the structural condition that prevents competitors from replicating the benefit. This is the moat itself. Without the barrier, the benefit is temporary. A competitor sees the benefit, copies the approach, and the benefit disappears.
Most operators can identify benefits. Few can identify barriers.
A restaurant with great food has a benefit. But the barrier is weak. Another chef can cook great food. Another restaurant can open across the street. The benefit does not persist because the barrier does not hold.
A platform with a million connected users has a benefit. And the barrier is structural. A competitor cannot start with a million connected users. The barrier holds because the network itself is the defense. The more users join, the wider the moat gets. The benefit and the barrier reinforce each other.
    THE DUAL REQUIREMENT

    ┌──────────────────────────┐      ┌──────────────────────────┐
    │                          │      │                          │
    │        BENEFIT           │      │        BARRIER           │
    │                          │      │                          │
    │  The advantage the       │      │  The structural          │
    │  moat confers            │      │  condition that          │
    │                          │      │  prevents copying        │
    │  - Higher margins        │      │                          │
    │  - Lower costs           │      │  - Network density       │
    │  - Better retention      │      │  - Cost structure        │
    │  - Pricing power         │      │  - Switching costs       │
    │                          │      │  - Learning curve        │
    │                          │      │                          │
    │  Shows up in             │      │  Does not show up        │
    │  the financials          │      │  in the financials       │
    │                          │      │                          │
    └──────────────────────────┘      └──────────────────────────┘
              │                                    │
              │                                    │
              └────────────────┬───────────────────┘
                               │
                               ▼
                  ┌──────────────────────┐
                  │                      │
                  │    BOTH REQUIRED     │
                  │                      │
                  │  Benefit alone       │
                  │  = temporary         │
                  │                      │
                  │  Barrier alone       │
                  │  = worthless         │
                  │                      │
                  │  Both together       │
                  │  = moat              │
                  │                      │
                  └──────────────────────┘
Benefit without barrier is a head start. Barrier without benefit is a wall around nothing.
Peter Thiel stated the same idea more bluntly in Zero to One (2014): “All happy companies are different: each one earns a monopoly by solving a unique problem. All failed companies are the same: they failed to escape competition.” The monopoly, in Thiel’s usage, is the moat. The unique problem is the benefit. The inability of competitors to replicate the solution is the barrier. The company that has both persists. The company that lacks either gets competed to zero.
PART TWO: THE TAXONOMY
Seven Structural Forms
Helmer identified seven distinct types of power. Seven structural forms a moat can take. Each has a specific benefit and a specific barrier. Each operates through a different mechanism. And each appears at a different stage of a company’s life.
The taxonomy matters because operators who cannot name the moat they are building usually are not building one.
| Power | Benefit | Barrier | Stage |
|---|---|---|---|
| Scale Economies | Lower unit costs | Cost gap too expensive to close | Growth to mature |
| Network Effects | Higher value per user | Network too large to replicate | Growth |
| Counter-Positioning | Superior business model | Incumbent cannot copy without self-damage | Origination |
| Switching Costs | Retained revenue | Customer exit cost exceeds switching value | Growth to mature |
| Branding | Pricing power | Trust and association built over time | Mature |
| Cornered Resource | Exclusive access | Resource cannot be obtained by competitors | Any |
| Process Power | Lower costs or higher quality | Organizational learning cannot be transferred | Mature |
Michael Porter’s Five Forces (1979, 1980) described the same territory from a different angle. Porter mapped the forces that compress profitability in an industry: rivalry among existing competitors, threat of new entrants, threat of substitutes, bargaining power of suppliers, and bargaining power of buyers. A moat, in Porter’s frame, is the structural condition that neutralizes one or more of these forces.
Helmer’s taxonomy is more operational for the individual business. Porter tells the operator which forces they face. Helmer tells them which structural defenses they can build.
PART THREE: SCALE ECONOMIES
The Cost Curve
Scale economies exist when the cost per unit decreases as volume increases.
The mechanism is straightforward. Fixed costs are spread across more units. A factory that costs ten million dollars produces the same overhead whether it makes ten thousand units or ten million. At ten thousand units, the fixed cost per unit is one thousand dollars. At ten million, it is one dollar.
This is the oldest moat in business. And the most misunderstood.
The misunderstanding is this: most operators think scale economies mean “bigger is better.” That is not what scale economies mean. Scale economies mean that the cost structure of the business rewards volume in a way that creates a structural disadvantage for smaller competitors.
The test is not whether the business is large. The test is whether a smaller competitor faces a cost penalty that makes competition unprofitable.
    SCALE ECONOMIES: THE COST CURVE

    Cost per
    unit ($)
         │
         │
    HIGH │██
         │  ██
         │    ██
         │      ████
         │          ████
    MED  │              ████████
         │                      ████████████
         │                                  ████████████████
    LOW  │                                                  ██████
         │
         └────────────────────────────────────────────────────────►
              LOW                    MED                    HIGH
                                  Volume

    The curve flattens. Beyond a certain volume,
    additional units add almost no cost advantage.
    The moat is in the steep section: where each
    additional unit creates significant separation.
Theodore Wright quantified this in 1936 while studying aircraft production at Curtiss-Wright. He found that every time total aircraft production doubled, the required labor time per unit fell by 20%. BCG later generalized this into the “experience curve” in the 1960s. The observation was that the cost decline was not just about spreading fixed costs. It was about accumulated learning, process improvement, and operational refinement that compound with volume.
The important structural observation is that scale advantages are not linear. They follow a curve. The first doubling of volume produces a large cost advantage. The tenth doubling produces almost none. This means scale economies create moats up to a certain size and then flatten. Beyond that size, the moat is not getting wider. It is just getting maintained.
Netflix’s original content strategy is the canonical modern example. The cost of producing a show is fixed. The cost of serving it to one more subscriber is near zero. At 100 million subscribers, the per-subscriber content cost is fundamentally different from a competitor at 10 million. The competitor must either match the content spend at a loss or accept an inferior library. Neither option is sustainable.
PART FOUR: NETWORK EFFECTS
The Value Curve
Network effects exist when each additional user increases the value of the product for all existing users.
This is structurally different from scale economies. Scale economies reduce cost. Network effects increase value. The directions are opposite but the defensive effect is similar. Both create a structural penalty for smaller competitors.
The telephone is the oldest example. One telephone is useless. Two telephones create one connection. Ten create forty-five. A hundred create nearly five thousand. The value of joining the network grows with the size of the network. Robert Metcalfe formalized this observation around 1980: the value of a network is proportional to the square of its connected users.
The n-squared formulation overstates the reality. Andrew Odlyzko and others have argued the practical curve is closer to n log n, because not all connections are equally valuable. But the structural point holds. Network value is superlinear. Doubling the users more than doubles the value.
    NETWORK EFFECTS: THE VALUE CURVE

    Value to
    each user
         │
         │                                              ██████████
         │                                        ██████
    HIGH │                                  ██████
         │                            ██████
         │                       █████
         │                  █████
    MED  │             █████
         │          ████
         │       ███
         │     ██
    LOW  │   ██
         │ ██
         │█
         └────────────────────────────────────────────────────────►
              LOW                    MED                    HIGH
                              Number of users

    Each new user increases value for all
    existing users. The curve is superlinear.
    A competitor starting from zero faces a
    value gap that widens with every user
    added to the incumbent network.
There are three distinct types and each creates a different defensive structure.
Direct network effects: Each user benefits directly from more users on the same side. Telephones. Messaging apps. Social networks. The mechanism is pure: more peers means more connections means more value.
Indirect network effects: Users on one side benefit from more users on a different side through complementary goods. More iPhone users attract more app developers. More app developers make iPhones more valuable. The mechanism operates through an intermediary layer.
Two-sided network effects: A platform connecting two distinct groups. More drivers make Uber more valuable to riders. More riders make Uber more valuable to drivers. Rochet and Tirole (2003) formalized this in the two-sided market literature, showing that platforms facing cross-group externalities can rationally subsidize one side to build the other.
    THREE TYPES OF NETWORK EFFECTS

    ┌──────────────────┐  ┌──────────────────┐  ┌──────────────────┐
    │                  │  │                  │  │                  │
    │     DIRECT       │  │    INDIRECT      │  │    TWO-SIDED     │
    │                  │  │                  │  │                  │
    │  User ←→ User    │  │  User → Comp.    │  │  Side A ←→       │
    │                  │  │  Comp. → User    │  │       Side B     │
    │                  │  │                  │  │                  │
    │  Same-side       │  │  Cross-layer     │  │  Cross-group     │
    │  value           │  │  value           │  │  value           │
    │                  │  │                  │  │                  │
    │  Phone, Slack,   │  │  iOS + App       │  │  Uber, eBay,     │
    │  WhatsApp        │  │  Store           │  │  Airbnb          │
    │                  │  │                  │  │                  │
    └──────────────────┘  └──────────────────┘  └──────────────────┘
The network effect moat has a specific structural property that other moats do not. It gets wider as the business grows. Scale economies flatten. Switching costs are bounded. Brand takes decades. But network effects compound with each user. The moat does not just hold. It deepens.
This is why Thiel identified network-effect businesses as the most durable monopolies. And why LinkedIn, despite being widely disliked as a product, maintains its position as the dominant professional network. The network is the moat. The product is the castle. The castle is mediocre. The moat is enormous.
PART FIVE: SWITCHING COSTS
The Exit Price
Switching costs exist when the cost of leaving exceeds the cost of staying.
The mechanism is not about making the product good. It is about making the departure expensive. These are structurally different things. A product can be excellent and have no switching costs. A product can be mediocre and have enormous switching costs.
SAP is the canonical case. The enterprise resource planning system is widely disliked. Users complain about the interface, the complexity, the cost of customization. But retention rates exceed 95%. The total cost of replacing an SAP installation, including infrastructure migration, consultant fees, retraining, workflow rebuilding, and business disruption, can exceed eleven times the original purchase price. Customers stay not because SAP is good. Customers stay because leaving is worse.
There are three categories of switching cost, and each operates through a different mechanism.
Transactional costs are the direct financial expenses. Contract termination penalties. Migration fees. New setup costs. Hardware replacement. These are visible and quantifiable.
Procedural costs are the operational friction. Retraining staff. Rebuilding workflows. Months of parallel operation during transition. Lost productivity during the learning curve. These are less visible but often larger than the transactional costs.
Relational costs are the loss of accumulated context. The institutional knowledge embedded in the current system. The relationships built with support teams. The customizations that represent years of organizational learning. These are nearly invisible and often the largest category of all.
    THE SWITCHING COST STACK

    ┌──────────────────────────────────────────────────────────┐
    │                                                          │
    │   RELATIONAL COSTS                           Largest     │
    │                                                          │
    │   Loss of institutional knowledge                        │
    │   Loss of embedded customizations                        │
    │   Loss of accumulated context                            │
    │   Loss of vendor relationship history                    │
    │                                                          │
    │   Nearly invisible. Hardest to quantify.                 │
    │                                                          │
    ├──────────────────────────────────────────────────────────┤
    │                                                          │
    │   PROCEDURAL COSTS                           Medium      │
    │                                                          │
    │   Staff retraining                                       │
    │   Workflow reconstruction                                │
    │   Transition period downtime                             │
    │   Parallel operation overhead                            │
    │                                                          │
    │   Partially visible. Underestimated.                     │
    │                                                          │
    ├──────────────────────────────────────────────────────────┤
    │                                                          │
    │   TRANSACTIONAL COSTS                        Smallest    │
    │                                                          │
    │   Contract penalties                                     │
    │   Migration fees                                         │
    │   New setup costs                                        │
    │                                                          │
    │   Fully visible. Usually overestimated                   │
    │   relative to the other two categories.                  │
    │                                                          │
    └──────────────────────────────────────────────────────────┘

    Operators who measure switching costs by the
    transactional layer alone underestimate the
    true cost by a factor of 5 to 10.
Kahneman and Tversky’s loss aversion compounds the effect. People feel losses roughly twice as intensely as equivalent gains. A customer considering a switch must believe the new product is not just better, but substantially better. Enough to overcome the perceived loss of the accumulated investment in the current product. The behavioral economics multiply the structural switching cost by a psychological factor that makes the effective barrier even higher than the rational calculation suggests.
This is why Slack retains enterprise accounts even when competitors offer superior pricing. Slack is not just software in those organizations. It has become part of the company’s communication identity, its language, its rituals. The procedural and relational switching costs dwarf the transactional cost of switching to a cheaper tool. The status quo bias, documented extensively by Samuelson and Zeckhauser (1988), reinforces the pattern. Humans prefer to stay with what they know even when the alternative is objectively better.
PART SIX: BRAND AND INTANGIBLE ASSETS
The Pricing Power Mechanism
Brand as a moat is the most abused concept in business strategy. Most operators who claim a “brand moat” have brand awareness, not a brand moat. The distinction is pricing power.
A brand that people recognize is not a moat. A brand that commands a price premium that persists through competition, recession, and market change is a moat.
Coca-Cola has raised prices through wars, recessions, and inflationary cycles for over a hundred years while maintaining customer loyalty. The product is sugar water. The moat is not the product. The moat is the association. Decades of consistent positioning have embedded the brand into the consumer’s default choice architecture. The consumer does not evaluate Coca-Cola against competitors on each purchase. The consumer reaches for the familiar. The brand operates below conscious deliberation.
| This connects to the prediction machinery described in [[THE_MACHINERY_OF_ATTENTION | The Machinery of Attention]]. The brain runs on prediction. A known brand reduces prediction error. The consumer knows what they will get. The unknown brand introduces uncertainty. Uncertainty is metabolically expensive. The brain prefers the known option not because it is better, but because it is cheaper to process. |
    BRAND AS PREDICTION ERROR REDUCTION

    ┌──────────────────────────────────┐
    │                                  │
    │     KNOWN BRAND                  │
    │                                  │
    │  Prediction: I know what I get   │
    │  Error: Low                      │
    │  Processing cost: Minimal        │
    │  Decision: Automatic             │
    │                                  │
    │  Result: Will pay a premium      │
    │  to avoid uncertainty            │
    │                                  │
    └──────────────────────────────────┘
                    │
                    │  versus
                    ▼
    ┌──────────────────────────────────┐
    │                                  │
    │     UNKNOWN BRAND                │
    │                                  │
    │  Prediction: Uncertain           │
    │  Error: High                     │
    │  Processing cost: Expensive      │
    │  Decision: Deliberative          │
    │                                  │
    │  Result: Requires a discount     │
    │  to compensate for uncertainty   │
    │                                  │
    └──────────────────────────────────┘

    The premium the known brand commands IS
    the moat. The premium reflects the
    prediction-error cost the consumer avoids.
Morningstar draws the same line. In their moat assessment framework, intangible assets qualify as a moat source only when they translate into pricing power. A well-known brand that cannot charge a premium is not an intangible asset moat. The brand must produce a measurable financial effect. Recognition without pricing power is marketing expense, not moat.
Other intangible assets operate through the same mechanism at the structural level. Patents create legal exclusion. Government licenses create regulatory exclusion. Trade secrets create informational exclusion. In each case, the intangible asset prevents competitors from replicating the benefit, which is the barrier component of Helmer’s dual requirement.
PART SEVEN: COUNTER-POSITIONING
The Dilemma Mechanism
Counter-positioning is the most powerful moat available to a new entrant. It exists when a newcomer adopts a business model that the incumbent cannot copy without damaging its existing business.
The mechanism is structural. The incumbent sees the new model. The incumbent understands the new model. The incumbent has the resources to copy the new model. But the incumbent cannot copy it without destroying something it already has.
Netflix versus Blockbuster is the clearest historical case. Netflix’s streaming model was visible to Blockbuster. Blockbuster understood it. Blockbuster had the resources to build it. But Blockbuster’s revenue model depended on physical stores and late fees. Adopting streaming meant cannibalizing both. The rational decision for Blockbuster, at every quarterly review, was to protect the existing revenue stream. By the time the existing revenue stream was already dying, the moat had been built.
Christensen described the same structure from the other direction in The Innovator’s Dilemma (1997). Disruptive technologies enter markets from below, serving customers the incumbent considers unprofitable. The incumbent’s own decision-making processes, the same processes that made it successful, rationally reject the disruptive technology because it does not serve existing customers at existing margins. Paradoxically, good management is the cause of the failure. The incumbent is not blind. It is structurally constrained by its own success.
    THE COUNTER-POSITIONING DILEMMA

    ┌──────────────────────────────────────────────────────────┐
    │                                                          │
    │                      INCUMBENT                           │
    │                                                          │
    │    Sees the new model:             YES                   │
    │    Understands the new model:      YES                   │
    │    Has resources to copy:          YES                   │
    │    Can copy without self-harm:     NO                    │
    │                                                          │
    │    The barrier is not ignorance.                         │
    │    The barrier is self-interest.                         │
    │                                                          │
    └──────────────────────────────────────────────────────────┘
                               │
                               │  meanwhile
                               ▼
    ┌──────────────────────────────────────────────────────────┐
    │                                                          │
    │                       ENTRANT                            │
    │                                                          │
    │    Has no existing revenue to protect.                   │
    │    The new model IS the only model.                      │
    │    No self-cannibalization risk.                         │
    │    Freedom to optimize fully for the new structure.      │
    │                                                          │
    └──────────────────────────────────────────────────────────┘

    The incumbent's moat against other incumbents
    becomes the entrant's moat against the incumbent.
    The very thing that made the incumbent strong
    is the thing that makes it unable to respond.
Counter-positioning is the rarest moat in Helmer’s taxonomy and the most powerful for new businesses. It is also the most time-limited. The window exists only while the incumbent’s existing business is large enough to constrain its response. Once the existing business declines past a certain point, the incumbent is free to pivot. By then, the entrant must have built a different moat to replace the counter-positioning that got it started.
Cornered Resource
A cornered resource is exclusive access to a valuable input that competitors cannot obtain.
The input can be talent. Pixar’s early moat was its animation team. A cluster of people who understood both computer science and visual storytelling at a level no one else could assemble. DeBeers controlled diamond supply. Qualcomm holds essential wireless patents.
The mechanism is exclusion. The resource is finite. The business controls it. Competitors are structurally locked out.
Cornered resources differ from the other powers in that they do not grow with the business. A network effect deepens as users join. Scale economies widen as volume increases. A cornered resource is either controlled or not. It does not compound. It is binary.
The risk is that cornered resources can become un-cornered. Patents expire. Key employees leave. Regulatory changes open markets. A cornered-resource moat requires continuous defense in a way that structural moats do not.
PART EIGHT: PROCESS POWER
The Organizational Learning Mechanism
Process power exists when an organization has embedded operational improvements so deeply into its culture, systems, and routines that competitors cannot replicate them even with full knowledge of what they are.
Toyota is the defining case. The Toyota Production System has been studied, documented, and taught in every business school on earth for fifty years. The knowledge is public. The principles are understood. And yet almost no competitor has successfully replicated it. The barrier is not information. The barrier is that the system is embedded in thousands of small decisions, relationships, cultural norms, and accumulated learning that cannot be transferred through documentation.
    PROCESS POWER: WHY KNOWLEDGE IS NOT ENOUGH

    ┌──────────────────────────────────────────────────────────┐
    │                                                          │
    │                  EXPLICIT KNOWLEDGE                      │
    │                                                          │
    │    Principles. Methods. Procedures. Documentation.       │
    │                                                          │
    │    Can be written down.                                  │
    │    Can be studied.                                       │
    │    Can be taught.                                        │
    │                                                          │
    │    This is NOT the moat.                                 │
    │                                                          │
    └──────────────────────────────────────────────────────────┘
                               │
                               ▼
    ┌──────────────────────────────────────────────────────────┐
    │                                                          │
    │                   TACIT KNOWLEDGE                        │
    │                                                          │
    │    Thousands of micro-decisions.                         │
    │    Cultural norms that shape behavior.                   │
    │    Relationships between specific people.                │
    │    Judgment calls refined over decades.                  │
    │    Coordination patterns that emerge, not designed.      │
    │                                                          │
    │    Cannot be written down.                               │
    │    Cannot be transferred.                                │
    │    Cannot be copied even with full access.               │
    │                                                          │
    │    THIS is the moat.                                     │
    │                                                          │
    └──────────────────────────────────────────────────────────┘
Process power takes the longest to build of any moat type. It requires years or decades of operational refinement, during which the learning is continuously embedded into the organization’s fabric. This makes it the most durable moat once established and the most difficult to build intentionally.
The experience curve, first formalized by BCG in the 1960s building on Wright’s 1936 observations, quantifies one dimension of this. Every doubling of cumulative output reduces unit costs by a predictable percentage. The reduction comes not from spreading fixed costs (that is scale economies) but from accumulated learning. Workers find shortcuts. Processes get refined. Waste gets eliminated. The learning compounds with every unit produced.
The structural property of experience-curve advantages is that they create an asymmetry between the incumbent and the entrant. The incumbent sits at the bottom of its cost curve, having accumulated decades of learning. The entrant starts at the top. The entrant must traverse the entire curve while competing against an incumbent already at the bottom. The cost gap during the traverse is the moat.
PART NINE: THE EROSION MECHANISM
No Moat Is Permanent
Every moat decays. The question is the rate.
Morningstar’s framework quantifies this. A wide moat is a competitive advantage expected to persist for twenty years or more. A narrow moat persists for ten years. No moat means the advantage can be competed away within a few years. Only about 10% of the companies Morningstar covers receive wide-moat ratings.
The measurement underneath is simple. A moat exists when return on invested capital (ROIC) exceeds the weighted average cost of capital (WACC). The width of the moat is how long that spread persists. When ROIC converges to WACC, the moat is gone. The business earns exactly what its capital costs. No excess returns. No pricing power. Commodity.
    MOAT WIDTH: ROIC VS WACC OVER TIME

    Return
    (%)
         │
         │  ████████████████████████████████
    ROIC │  ████████████████████████████████████████████
         │  ████████████████████████████████████████████████████████
         │
    WACC ├─ ─ ─ ─ ─ ─ ─ ─ ─ ─ ─ ─ ─ ─ ─ ─ ─ ─ ─ ─ ─ ─ ─ ─ ─ ─
         │
         │
         └──────────────────────────────────────────────────────────►
              WIDE MOAT          NARROW MOAT         NO MOAT
              (20+ years)        (10+ years)         (<5 years)

    The spread between ROIC and WACC is the moat.
    The duration of the spread is the width.
    When they converge, the business is a commodity.
Christensen’s disruption model describes the primary erosion mechanism. Incumbents optimize for their best customers, moving upmarket, improving margins, adding features. This creates a vacuum at the bottom of the market. New entrants fill the vacuum with simpler, cheaper, worse products. The incumbent ignores them because the entrant’s customers are unprofitable. Over time, the entrant improves. The entrant’s product becomes good enough for the incumbent’s customers. By the time the incumbent notices, the entrant has built its own moat in the low end of the market and is moving upward.
    THE DISRUPTION CURVE

    Product
    performance
         │
         │                                    ██████████ Incumbent
         │                              ██████          trajectory
         │                        ██████
         │                  ██████
    ─────│──────────────────────────────────── Market demand
         │            ██████                   threshold
         │      ██████
         │██████
         │                              ██████████████ Disruptor
         │                        ██████               trajectory
         │                  ██████
         │            ██████
         │      ██████
         │██████
         └──────────────────────────────────────────────────────────►
                                                              Time

    The incumbent overshoots market needs.
    The disruptor starts below market needs.
    The curves cross. That crossing is where
    the incumbent's moat starts to erode.
The critical observation is that disruption is not random. It is structural. It happens because the incumbent’s own optimization process creates the opening. The better the incumbent serves its current customers, the wider the gap at the bottom, and the more room the disruptor has to enter.
Other erosion mechanisms include technology shifts that make an existing moat irrelevant (the combustion engine moat evaporating in the face of electric vehicles), regulatory changes that remove barriers (deregulation opening protected markets), and management complacency (process power degrading because the organization stops learning).
PART TEN: THE POWER LAW OF RETURNS
Winner-Take-Most Markets
The distribution of returns across businesses is not normal. It follows a power law.
A small number of businesses in any market capture a disproportionate share of the total profits. The top player does not earn slightly more than the second player. The top player earns multiples more. The second earns multiples more than the third. The tail is long and nearly flat.
Vilfredo Pareto observed this in the 1890s studying wealth distribution in Italy. Roughly 80% of the land was owned by 20% of the population. The same distribution appears in nearly every competitive system. 80% of industry profits accrue to the top 20% of firms. 80% of that 80% accrues to the top 20% of the top 20%. The distribution is recursive.
    THE POWER LAW OF BUSINESS RETURNS

    Profit
    share
         │
         │██
    HIGH │████
         │██████
         │████████
         │██████████
         │  ██████████████
    MED  │      ██████████████████
         │          ██████████████████████████
         │                ████████████████████████████████
    LOW  │                          ██████████████████████████████
         │
         └──────────────────────────────────────────────────────────►
           #1    #2    #3    #4    #5   #6   #7   #8   #9  #10+

                              Market rank

    Returns are not normally distributed.
    The #1 player captures more than the
    next five combined. The tail is long
    and nearly flat. Most participants
    earn near-zero economic profit.
The connection to moats is direct. The businesses at the head of the power law are the ones with moats. The businesses in the tail are the ones without. The moat is the structural condition that concentrates returns at the top.
In winner-take-most markets, typically those with network effects or high switching costs, the distribution is even more extreme. The alpha value drops below 1.16 (the classic 80/20 split) and approaches 95/5 or 99/1. A single platform captures nearly all the value. LinkedIn in professional networking. Google in search. Amazon in e-commerce. The moat and the power law reinforce each other. The moat creates the concentration. The concentration deepens the moat.
The operator who does not have a moat is competing in the tail. Every dollar of revenue in the tail is contested by dozens of competitors. Margins compress toward zero. The business survives on execution, not structure. Execution alone cannot produce the power-law concentration required for compounding returns.
PART ELEVEN: THE LIFECYCLE
How the Moats Stack
    THE MOAT LIFECYCLE

    ┌──────────────────────────────────────────────────────────┐
    │                                                          │
    │                    ORIGINATION                           │
    │                                                          │
    │    Counter-positioning. Cornered resource.               │
    │    Available at founding. Time-limited.                  │
    │    Must transition to structural moats                   │
    │    before the window closes.                             │
    │                                                          │
    └──────────────────────────────────────────────────────────┘
                               │
                               │  transitions to
                               ▼
    ┌──────────────────────────────────────────────────────────┐
    │                                                          │
    │                      GROWTH                              │
    │                                                          │
    │    Scale economies. Network effects.                     │
    │    Switching costs. These compound                       │
    │    with the business. Each customer,                     │
    │    each unit, each user deepens the moat.                │
    │                                                          │
    └──────────────────────────────────────────────────────────┘
                               │
                               │  matures into
                               ▼
    ┌──────────────────────────────────────────────────────────┐
    │                                                          │
    │                      MATURITY                            │
    │                                                          │
    │    Branding. Process power.                              │
    │    These take decades to build.                          │
    │    Hardest to replicate.                                 │
    │    Most durable once established.                        │
    │                                                          │
    └──────────────────────────────────────────────────────────┘
Most durable businesses have multiple moats operating simultaneously. Amazon has scale economies in logistics, network effects in its marketplace, switching costs through Prime membership, and process power in its operational culture. Each moat reinforces the others. The combination is more defensible than any single moat alone.
Thiel’s observation in Zero to One is that proprietary technology must be at least ten times better than its closest substitute to create a real monopolistic advantage. The “10x” threshold is not arbitrary. It is the point at which the new product’s benefit is large enough to overcome the switching costs, brand inertia, and network-effect advantages of the incumbent. Below 10x, the improvement is not enough to justify the cost of change. Above 10x, the cost of change becomes irrelevant relative to the benefit.
PART TWELVE: OPERATOR NOTES
Pattern-Level Observations
The following observations describe regularities that repeatedly appear in businesses the operator may encounter. They are not prescriptions. They are descriptions of structural patterns.
Most small businesses have no moat at all. A local restaurant, a freelance consultancy, a small e-commerce store. These businesses compete on execution, relationships, and hustle. They may be profitable. They may even be excellent. But they have no structural defense against competition. A competitor with equivalent execution can enter and compete for the same customers at equivalent cost. Revenue in these businesses is a function of effort, not structure. The moment effort stops, revenue stops. This is not a judgment. It is a structural observation.
The most common mistake is confusing head start with moat. Being first to market is not a moat. Being first gives the business a window to build a moat. If the window closes without a moat being built, being first becomes irrelevant. MySpace was first. Friendster was first. Google was not first in search. Amazon was not first in online retail. The first mover that builds a moat wins. The first mover that does not gets replaced.
Revenue growth masks the absence of a moat. A business growing at 30% per year feels invincible. The operator does not question defensibility because the numbers are going up. Growth is the anesthetic. The pain arrives when growth attracts competitors, and competitors arrive without the cost structure the growing business has accumulated. If the business has no structural defense, the competitors can undercut on price because they have no legacy costs. The growth that felt like strength was actually the signal that attracted the threat.
A moat determines the ceiling, not the floor. A business with a wide moat can have terrible execution and still survive. A business with no moat can have excellent execution and still fail. The moat sets the upper bound on what the business can become. Execution determines where within that bound the business actually operates. Optimizing execution in a business with no moat raises the floor temporarily. It does not raise the ceiling.
Ghost kitchens and delivery brands have structurally weak moats. The barrier to entry is low. Equipment is commoditized. Menus can be copied. Delivery platforms control the customer relationship. The only moat paths available are brand (which takes years of consistent delivery quality to build), proprietary operational processes (which require scale to justify), and multi-brand portfolio effects (where the same kitchen serves multiple brands, creating a cost advantage over single-brand competitors). The operator in this space who does not consciously build one of these is competing on execution alone, which means competing in the tail of the power-law distribution.
Counter-positioning is the single highest-leverage move available to a new business. Finding the model that the incumbent cannot copy without destroying its own revenue is the closest thing to a structural shortcut in business strategy. It buys time. Time is the resource required to build every other type of moat. Without counter-positioning, the new business must build its moat while the incumbent is actively trying to crush it. With counter-positioning, the incumbent is structurally unable to respond, which gives the new business the runway to compound.
Network effects are the only moat that gets wider automatically. Every other moat requires active maintenance. Scale economies require continued volume. Switching costs require continued integration depth. Brand requires continued investment. Process power requires continued learning. Network effects, once past critical mass, deepen with every new user regardless of what the operator does. This is why network-effect businesses dominate the head of the power-law distribution. The moat compounds without additional effort.
The most dangerous moment for a moat is when it is working. The returns feel permanent. The margins feel natural. The operator stops investing in the structural defense because the defense is invisible. Then a technology shift, a regulatory change, or a Christensen-style disruptor enters from below, and the moat that was not being maintained erodes faster than the operator believed possible. Blockbuster’s moat was working perfectly in 2004. By 2010 the company was bankrupt. The erosion was structural, not operational.
Moats are built during growth, not before it. The operator who waits until the business is stable to think about defensibility has already missed the window. Counter-positioning is only available at origination. Network effects require early aggressive user acquisition. Scale economies require investment in volume before the volume is profitable. Every moat type has a window during which it can be built. Outside that window, the cost of building it rises sharply or the opportunity disappears entirely.
CITATIONS
Foundational Strategy
Economic Moats and Durable Competitive Advantage
Buffett, W. (1995). Berkshire Hathaway Annual Shareholders Meeting. Discussion of “wide moat” concept. Archived transcripts at berkshirehathaway.com.
Buffett, W. (2007). Berkshire Hathaway Annual Letter to Shareholders. “The key to investing is not assessing how much an industry is going to affect society, or how much it will grow, but rather determining the competitive advantage of any given company and, above all, the durability of that advantage.”
7 Powers Framework
Helmer, H. (2016). 7 Powers: The Foundations of Business Strategy. Deep Strategy LLC.
Helmer, H. (2023). Interview on Acquired podcast. “7 Powers with Hamilton Helmer.” https://www.acquired.fm/episodes/7-powers-with-hamilton-helmer
Helmer, H. Interview on Lenny’s Newsletter. “Business strategy with Hamilton Helmer.” https://www.lennysnewsletter.com/p/business-strategy-with-hamilton-helmer
Competitive Strategy and Five Forces
Porter, M. E. (1979). “How Competitive Forces Shape Strategy.” Harvard Business Review, March 1979.
Porter, M. E. (1980). Competitive Strategy: Techniques for Analyzing Industries and Competitors. Free Press.
Porter, M. E. (2008). “The Five Competitive Forces That Shape Strategy.” Harvard Business Review, January 2008. https://hbr.org/2008/01/the-five-competitive-forces-that-shape-strategy
Zero to One
Thiel, P. with Masters, B. (2014). Zero to One: Notes on Startups, or How to Build the Future. Crown Business.
Network Science and Network Effects
Metcalfe, B. (2013). “Metcalfe’s law after 40 years of Ethernet.” Computer, 46(12), 26-31.
Briscoe, B., Odlyzko, A., & Tilly, B. (2006). “Metcalfe’s law is wrong.” IEEE Spectrum, 43(7), 34-39. https://spectrum.ieee.org/metcalfes-law-is-wrong
Rochet, J.-C. & Tirole, J. (2003). “Platform competition in two-sided markets.” Journal of the European Economic Association, 1(4), 990-1029.
Parker, G. G. & Van Alstyne, M. W. (2005). “Two-sided network effects: A theory of information product design.” Management Science, 51(10), 1494-1504.
NFX. “The Network Effects Manual: 16 Different Network Effects (and counting).” https://www.nfx.com/post/network-effects-manual
Barabási, A.-L. & Albert, R. (1999). “Emergence of scaling in random networks.” Science, 286(5439), 509-512.
Disruption and Moat Erosion
Christensen, C. M. (1997). The Innovator’s Dilemma: When New Technologies Cause Great Firms to Fail. Harvard Business School Press.
Christensen, C. M., Raynor, M. E., & McDonald, R. (2015). “What is disruptive innovation?” Harvard Business Review, December 2015. https://hbr.org/2015/12/what-is-disruptive-innovation
Switching Costs and Behavioral Economics
Kahneman, D. & Tversky, A. (1979). “Prospect theory: An analysis of decision under risk.” Econometrica, 47(2), 263-291.
Samuelson, W. & Zeckhauser, R. (1988). “Status quo bias in decision making.” Journal of Risk and Uncertainty, 1, 7-59.
Klemperer, P. (1987). “Markets with consumer switching costs.” Quarterly Journal of Economics, 102(2), 375-394.
Farrell, J. & Klemperer, P. (2007). “Coordination and Lock-In: Competition with Switching Costs and Network Effects.” Handbook of Industrial Organization, Vol. 3. https://www.sciencedirect.com/science/article/abs/pii/S1573448X06030317
Scale Economies and Experience Curves
Wright, T. P. (1936). “Factors affecting the cost of airplanes.” Journal of the Aeronautical Sciences, 3(4), 122-128.
Boston Consulting Group (1968). Perspectives on Experience. BCG.
Berndt, E. R. (1991). The Practice of Econometrics: Classic and Contemporary. Addison-Wesley.
Moat Measurement and Classification
Morningstar. “The Morningstar Economic Moat Rating.” https://www.morningstar.com/stocks/morningstar-economic-moat-rating-3
VanEck / Morningstar (2025). “What Makes a Moat? Morningstar’s Five Sources of Moat.” White paper. https://www.vaneck.com/us/en/investments/morningstar-wide-moat-etf-moat/what-makes-a-moat-white-paper.pdf/
Mauboussin, M. J. & Callahan, D. “Measuring the Moat.” Morgan Stanley Counterpoint Global Insights. https://www.morganstanley.com/im/publication/insights/articles/article_measuringthemoat.pdf
Power Laws and Market Concentration
Pareto, V. (1896). Cours d’économie politique. University of Lausanne.
Newman, M. E. J. (2005). “Power laws, Pareto distributions and Zipf’s law.” Contemporary Physics, 46(5), 323-351. https://arxiv.org/abs/cond-mat/0412004
Brand and Intangible Assets
Aaker, D. A. (1991). Managing Brand Equity: Capitalizing on the Value of a Brand Name. Free Press.
Keller, K. L. (1993). “Conceptualizing, measuring, and managing customer-based brand equity.” Journal of Marketing, 57(1), 1-22.
Process Power
Liker, J. K. (2004). The Toyota Way: 14 Management Principles from the World’s Greatest Manufacturer. McGraw-Hill.
Spear, S. & Bowen, H. K. (1999). “Decoding the DNA of the Toyota Production System.” Harvard Business Review, September-October 1999.
Document compiled from primary source research across strategy literature, network science, behavioral economics, and direct analysis of competitive dynamics. Every structural claim traces to a named primary source.
Related Machineries
-
[[THE_MACHINERY_OF_COMPETITION The Machinery of Competition]]. Competition is the force moats defend against. The competition guide describes how markets converge toward commoditization. The moat guide describes the structural conditions that prevent that convergence. -
[[THE_MACHINERY_OF_DISTRIBUTION The Machinery of Distribution]]. Distribution is how the castle gets built. The moat is how the castle gets defended. The most durable distribution channels (owned, compounding) are themselves a form of moat, because they create structural advantages that competitors cannot replicate quickly. -
[[THE_MACHINERY_OF_PRICING The Machinery of Pricing]]. Pricing power is the financial expression of a moat. A business with a wide moat can sustain prices above the competitive level. A business without a moat gets competed to marginal cost. The pricing guide describes the mechanism of price discovery. The moat guide describes what determines the ceiling on that price. -
[[THE_MACHINERY_OF_SCALE The Machinery of Scale]]. Scale is one of the seven structural forms a moat can take. The scale guide describes how businesses grow. The moat guide describes when that growth produces lasting structural defense and when it does not. -
[[THE_MACHINERY_OF_BRAND The Machinery of Brand]]. Brand is one of the seven structural forms a moat can take. The brand guide describes how trust accumulates. The moat guide describes when that accumulated trust becomes a structural barrier to competition. -
[[THE_MACHINERY_OF_RETENTION The Machinery of Retention]]. Retention and switching costs are deeply connected. Retention is the operational outcome. Switching costs are the structural mechanism that produces it. High retention without switching costs is execution. High retention with switching costs is moat. -
[[THE_MACHINERY_OF_ATTENTION The Machinery of Attention]]. Brand moats operate through the prediction-error architecture of attention. Known brands reduce prediction error and processing cost. The consumer pays a premium to avoid uncertainty. The attention guide describes the mechanism. The moat guide describes its strategic consequence.